Top List of Stock Volume Indicators
Many professional traders use the stock volume indicators to define the trends that occur in the stock marketplace. There are typical methods used for analyzing volume to identify the validity or vulnerability of a stock. Investors most likely are looking at the trends and price movements in the stock market to define the future changes and get rational and effective decisions, which promise them successful trading and benefits. They can find it easy to analyze the situation in the marketplace while using the
best volume indicators for stocks.
Usually, the volume increases in the market which is growing. Traders in this case raise their interests to keep the market continuing this way. Through the process of price increasing and volume decreasing traders are allowed to conclude that the market most probably is experiencing a lack of interest, which most probably is going to show them a reverse scenario. However, it should be said that in the stock market those kinds of expectations may not get real and false signals may lead you to money loss.
You are able to see slow moves in either a rising or falling market. There are typically sudden price shifts accompanied by a quick rise in production, indicating the likely end of a trend.
Dropping markets eventually evict a large number of sellers at a price bottom, resulting in increased volatility and volume. In these scenarios, when using the volume price trend tracker in stocks, you are able to see a decrease in volumes after the rise, but how volume performs in the coming period can be calculated using the other volume laws.
So, in order to measure all of the discussed things in the stock marketplace, we are offering you to use those 3 best stock volume indicators, that additionally show you the bullish signs, reveal stock’s volume and price, and show whether the breakout is real or false. Those top 3 stock volume indicators are:
- OBV (On-Balance Volume)
- Volume RSI
- Chaikin Money Flow
In order to make it simple how the
volume price trend indicator in stocks work, let’s discuss them one by one.
OBV (On-Balance Volume)
The OBV indicator, also known as on-balance volume, is one of the measurements for technical analysis. This indicator correlates fluid velocity to price movements in the market. It forecasts market movement using a total of positive and negative trade volume. Since the OBV is a volume-based momentum oscillator, it is a leading indicator, changing course before the price.
Philip Granville discovered this volume measure. Granville suggested the hypothesis that variable increases in volume accompany price fluctuations. He concluded that volume was the driving force behind big market movements and compared OBV's price forecast to a compressed spring that spreads rapidly when released.
In order to calculate the
best volume indicators in stock trading using OBV, here’s the following formula:
OBV = OBVpre + Volume
In this formula, OBV stands for present on-balance volume rate, OBVpre is a previous on-balance volume level and Volume shows present trading volume.
OBV is a running total of market volume that indicates whether there is a transaction inflow or outflow. So, based on how the current price closes in relation to the previous session's close, the actual OBV can be determined in three different ways:
If the closing price of the current session is greater than the closing price of the previous session, then: Current OBV = Previous OBV + Volume of the current session.
If the closing price of the present session equals the price change of the previous session, then: Past OBV = Present OBV.
If the closing price of the actual session is less than the closing price of the previous session — Current OBV = Previous OBV – Current session's volume.
In order to get beneficial information through
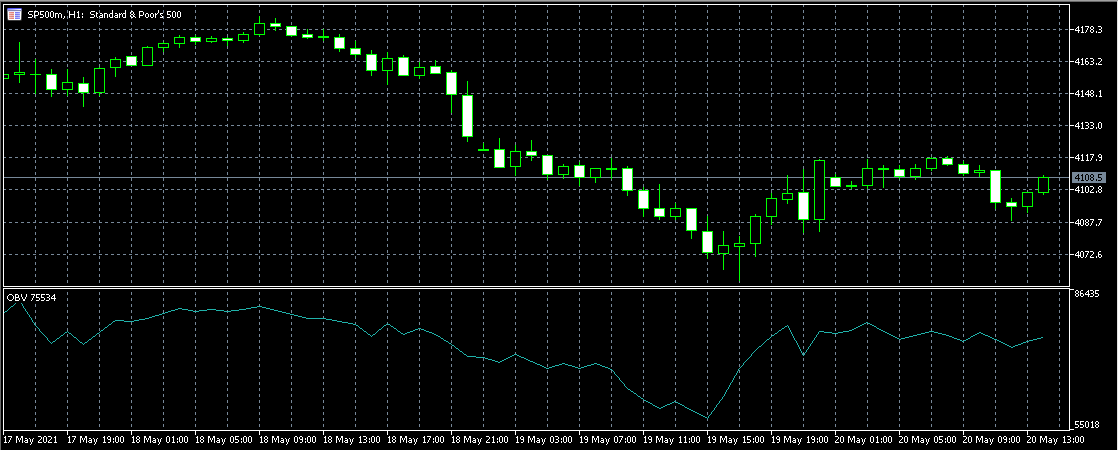
volume indicators in the stock market, you should know how it can be interpreted. The OBV is thought to represent market trends across financial institutions and other traders. The OBV is shown as a line chart on a screen different from the main price chart. Since the OBV indicator is an aggregate actual value, it can rise as the price rises and decline when the market falls.
If the price makes a new record, the OBV can follow suit. Whenever the OBV makes a lower high while the market makes a higher high, this is a typical bearish variance, meaning that only retail buyers are investing.
Another form of bearish volatility, which can be defined with the help of this
volume indicator in stock trading, happens when the market stays comparatively steady and barely makes a higher peak, however, the OBV jumps over the previous high, signaling that retail traders are building short positions. In all cases, there is a good risk that the price will fall.
The main idea behind OBV is founded on the differentiation between smart capital – i.e., financial institutions – and less-skilled individual investors. Volume can rise as mutual funds continue to buy into a concern that institutional traders are selling, even though the price stays reasonably stable. Eventually, the price rises due to increased volume. At that moment, larger investors start selling, while smaller investors start buying.
Although the
stock price-volume indicator is plotted on a price graph and arithmetically calculated, the following algorithm valuation of OBV is irrelevant. The metric is conditional, but the time interval is set by a dedicated starting point, so the actual number value of OBV is determined randomly by the start date. Rather, traders and observers examine the dynamics of OBV fluctuations over time; the slope of the OBV line bears much of the weight of the research.
Volume numbers on the OBV are used by analysts to screen big, institutional investors. They see price-volume divergences as a metaphor for the interaction between "smart capital" and the diverse masses, aiming to highlight prospects for buying against incorrectly dominant patterns. For example, institutional capital can push up the price of an asset before selling as other investors follow suit.
One downside of
trading stock with a volume indicator is that it is a leading predictor, which means that while it can make forecasts, it can only tell so much about what has already happened based on the signals it generates. As a result, it is vulnerable to producing misleading signals. As a result, lagging metrics should be used to even it out. Add a moving average line to the OBV to check at OBV line breakouts; a market breakout will be confirmed if the OBV predictor also breaks out.
Volume RSI
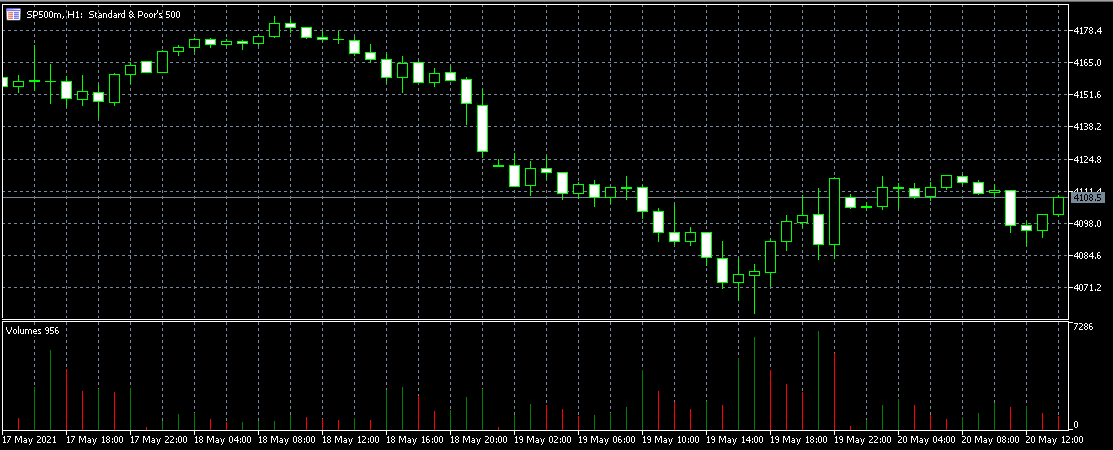
The volume RSI is a volume variable that calculates the rate and shift of volume during the prices higher (up-volume) and price bottom (down-volume). It is a momentum indicator that attempts to predict market pattern changes by analyzing fluctuations through the bullish and bearish data of volume.
To say more simply, RSI which indicates the volume changes is similar to price RSI, which shows price changes in the market. So, through this
volume indicator in stocks, traders can define the difference between the volume that was during the trading process when the close price was higher to the volume that was defined when an asset’s volume during a trading session had a lower close price rate.
In order to calculate the final rate of the RSI, investors need to take several steps. First, investors need to calculate the changes in volume during the trading sessions when the close price was the highest and when the close price was the lowest. After that, they need to define the time they are going to calculate the rate of RSI and find the moving average for the sessions of up-close and down-close. The next step is to calculate the RS, which is also known as the relative strength factor. After that traders are allowed to find the ratio of the RSI. The final step is to define what kind of information you want to get with the help of the RSI indicator - the ratio of down-volume or up-volume.
If you want to calculate up-volume during the moment when the close price was higher, then you need to use this formula:
Up-volume = actual volume - previous volume
If you want to use this formula for down-close, you should use it like this:
Down-volume = previous volume - present volume.
In case of the close price stays stable and doesn’t change, both up-volume and down-volume equal zero.
In order to find Smoothed Moving Average for n-period from the up-volume and down-volume, you need to use this formula:
First Average Up-Volume = Aggregate Up-Volumes during the previous n periods/n
First Average Down-Volume = Aggregate Down-Volumes over the previous n periods/n
If you want to find the relative strength factor, which is a significant part of the RSI formula, you need to follow this formula:
RS = SMMA (Up-volume, n)/SMMA (Down-volume, n).
After that you can calculate RSI like this: RSI = 100 – [100/(1 + RS)].
The volume RSI is viewed similarly to the price-based RSI. This stock market volume indicator ranges between 0 and 100 percent and along the 50 percent axis. Around the 30% line, the price is considered overvalued, which means that many investors are selling their assets, in contrast with that, above the 70% line, the market is considered overbought. Bullish investors are in control as the indicator rises from the oversold area and hits the 50 percent threshold. Bearish investors, on the other hand, dominate as the indicator falls from the overbought area and hits the 50% mark.
Chaikin Money Flow
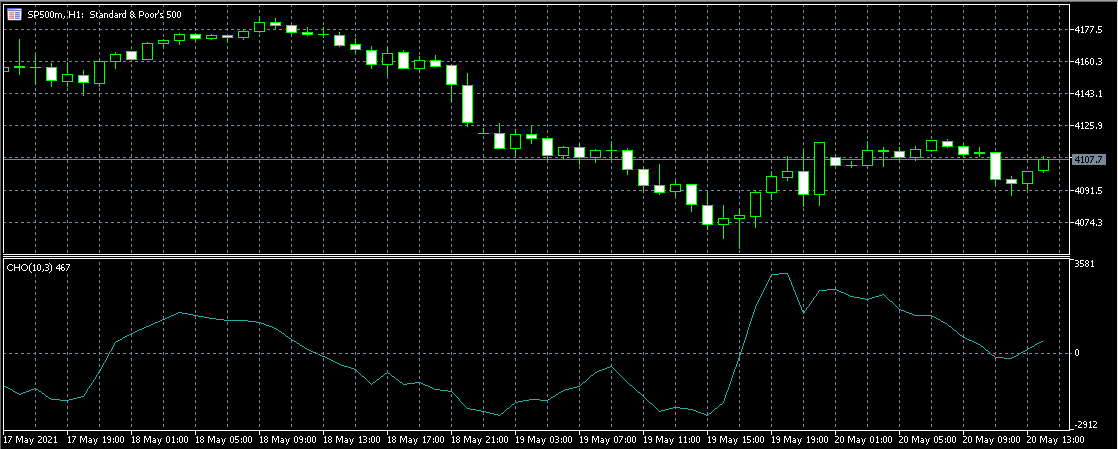
The Chaikin money flow indicator (CMF) is a volume tracker that calculates the mass of cash flow over a specified time span, usually 20 or 21 cycles. Marc Chaikin developed the indicator, which uses the money flow volume — which also provides a framework for the accumulation distribution index, but instead of a cumulative number, the CMF provides the value of the money flow volume.
The money flow volume is a calculation of the volume and where the market closed in relation to the scope of the trading session. It is built on the hypothesis that growing volume and sustained closes in the upper part of the session's price point suggest purchasing force, whereas rising volume and repeated closes in the lower part of the price range imply selling tension.
Both purchasing and sale forces are followed by a rise in value, but the closing rates are aligned with the market path. As a result, the tracker floats along the zero axis, with a spike above zero suggesting a bullish trend and a trend below zero showing a bearish trend.
Through looking at volume trends, traders are allowed to get the chances of a certain stock, the way it is going to uptrend or downtrend. Also, through the asset’s popularity investors are able to define whether the stock is going to reach its highest level in terms of the price or going down. Volume and the money flow have a significant role for those traders who are trading with the use of technical analysis. Through the volume, investors can find out what is the market power, for the present time, and whether the market is going to stay stable or become volatile.
In order to calculate CMF, you need to take several steps. Firstly you should calculate the money flow multiplier, also known as CLV, which shows close location value. After that, you need to find the volume of money flow and the last step is to find CMF.
To calculate CLV you need to find the lowest close prie and the highest closing price. Then follows this formula:
CLV = [(Close – Low) – (High – Close)] / (High – Low).
The second step is calculating the volume of money flow. In this case, you need to multiply CLV to Volume.
And the final step is calculating CMF with the use of this mathematical formula:
CMF = (n-period sum of Money Flow Volume) / (n-period sum of Volume).
In this formula “n” stands for the period of choice. Usually, traders are taking numbers 20 and 21, where the result is more accurate.
This volume indicator fluctuates throughout +1 and -1 but can never reach both peaks so it will take successive closings at the upside or downside around the whole n-period for the CMF to reach +1 or -1. It would often only move up and down between +0.4 and -0.4, with 0 as the centerline.
When the tracker increases above the zero lines into a positive trajectory, it indicates that purchasing demand is increasing and selling interest is decreasing. When it falls underneath the zero lines, there is an increase in selling tension and a decrease in bullish pressure. In addition, the index will indicate bearish and bullish divergences.
The Chaikin oscillator is more of a guide for technical analysts than for fundamental analysts, who research a company's market results to determine the potential trajectory of its stock price. Fundamental analysts conclude that being the best knowledge is the expertise required to predict the economy. Technical experts conclude that all existing knowledge has already been priced into securities and that trends of share price fluctuations will help forecast price swings. The Chaikin oscillator is used by forecasters who are more like technical analysts to identify directional patterns in motion.
The Chaikin oscillator's aim is to define essential movement through variations in accumulation distribution. It uses the MACD predictor to monitor accumulation distribution instead of closing prices.