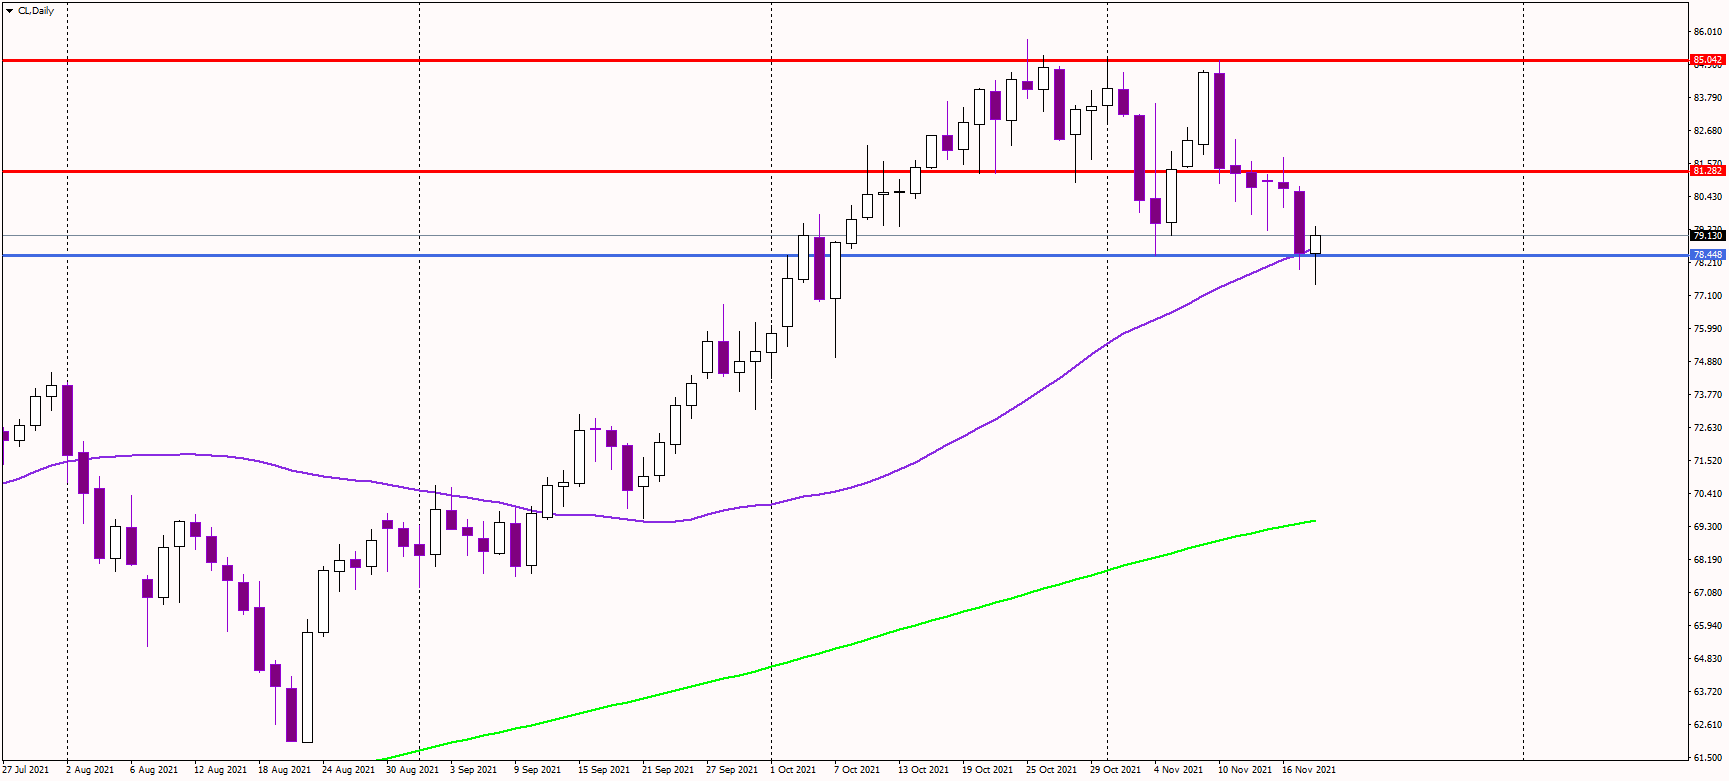
The WTI oil corrected notably over the previous days, and it dropped below 78 USD today, although it has managed to bounce back above that level so far.
It looks like a multiple top pattern near the 85 USD resistance, a bearish reversal formation, with a total potential of 6.50 USD. The neckline of this pattern at 78.30 USD has been broken today, but oil needs to close below it on a daily chart to make it valid.
The final target of the pattern is at 72 USD, making a 15% decline from the cycle top at 85 USD. It could be a healthy correction after the recent steep run higher.
Alternatively, oil must climb above 81 USD to change the short-term momentum to bullish again. Only a close above 85 USD could renew the long-term uptrend.
Still, oil remains the best inflation hedge, and should inflation continue to rampage; we might see the WTI rising toward the psychological 100 USD level.
From the macro data, traders paid attention to the US jobless claims, which printed 268,000, down from 269,000 previously but above the 260,000 expected. Continuing claims improved notably to 2.08 million. Additionally, the Philadelphia Fed Manufacturing Survey jumped to 39 in November, well above 23.8 scored in October.

OIL Daily chart 3PM CET