Weekly Market Commentary | 05.02 – 11.02
05 February 2024

Curious to know what’s happening on the markets this week? Take a quick tour of the latest news, economic updates, and trading setups that will keep you up-to-date and in the know!
Monday:
- The week kicked off with Caixin Services PMI from China, hitting the mark at 52.7, aligning with market expectations.
- The day is set to conclude with the anticipated ISM Services PMI from the US, with forecasts suggesting an uptick to 52, indicating potential optimism in the services sector.
Tuesday:
- Australia's interest rate decision is on the radar, with predictions favoring a steady rate at 4.35%. The accompanying statement and subsequent press conference will be scrutinized for future monetary policy clues.
- The UK’s construction PMI is expected at 47.2, potentially reflecting ongoing challenges in the sector.
- Canada's Ivey PMI, anticipated at 55, will offer insights into the business climate.
- The day wraps up with Bank of Canada Governor Macklem’s speech, alongside crucial job data from New Zealand, highlighting an expected unemployment rate jump to 4.3%.
Wednesday:
- A relatively subdued Wednesday features speeches from FOMC members Kugler and Barkin, providing investors with insights into the Federal Reserve's perspective.
Thursday:
- China's inflation data is forecasted to dip to -0.5%, suggesting deflationary pressures.
- The US will release its weekly unemployment claims, a consistent measure of labor market health.
- FOMC member Barkin takes the stage again, potentially offering more depth into the Fed's current economic assessment.
- The day concludes with a speech from Reserve Bank of Australia Governor Bullock, likely shedding light on Australia’s economic outlook.
Friday:
- Canada's job market will be under the spotlight, with unemployment expected to inch up to 5.9%, providing a glimpse into the country's economic resilience.
Setups for This Week:
GBPUSD
Primary View:
- GBPUSD has been exhibiting a sideways movement within a symmetric triangle pattern highlighted in red.
- The previous week concluded with a significant bounce off the upper boundary, culminating in a breakthrough below the triangle's lower edge.
- The commencement of the new week finds the pair trading beneath the triangle's lower boundary, simultaneously challenging a pivotal horizontal support at 1.262, delineated in green. A daily close below this green mark would confirm a sell signal.
Alternative View:
- A rebound into the confines of the symmetric triangle would negate the bearish outlook and indicate a potential buy opportunity.
 AUDUSD
Primary View:
- A prominent head and shoulders formation is evident on the AUDUSD daily chart.
- Recently, there was a breach of critical horizontal support, identified with a green line, thus triggering a sell signal.
Alternative View:
- Should the price ascend above this green threshold once more, it would invalidate the bearish scenario and suggest a bullish signal.
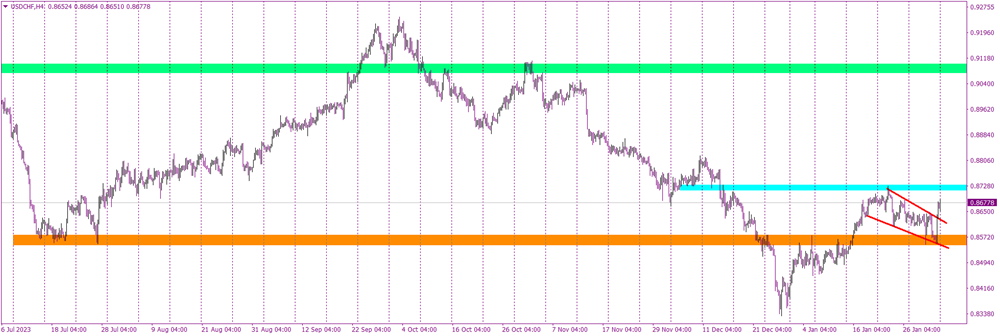
 USDCHF
Primary View:
- USDCHF has successfully broken free from a flag formation, depicted with red lines, heading northward.
- This escape is viewed positively and is interpreted as a cue to buy.
Alternative View:
- A retreat back into the flag's territory would reverse the optimistic sentiment, indicating a sell signal.
