Weekly Market Commentary | 10.07 – 16.07
10 July 2023

Curious to know what’s happening on the markets this week? Take a quick tour of the latest news, economic updates, and trading setups that will keep you up-to-date and in the know.
Monday:
- Inflation data from China was reported, coming in at 0% and below the expected 0.2%.
- Similarly, Producer's inflation (PPI) from China plummeted to -5.4%.
- The day concludes with a speech by the Bank of England Governor Bailey.
Tuesday:
- The only key data will be the UK's Claimant Count change announcement.
Wednesday:
- New Zealand's interest rate decision is expected to hold at 5.5%.
- A speech by both the Reserve Bank of Australia Governor Lowe and Bank of England Governor Bailey.
- Inflation data from the US is projected to drop year-on-year to 3.1% from the previous 4%.
- The day wraps up with Canadian interest rate data, with an expected rise of 25 basis points to 5%; along with the rate statement, monetary policy report, and press conference.
Thursday:
- The day kicks off with UK GDP data, expected to decline by 0.3%.
- Producer's inflation from the US presumed to come in at 0.2%.
- Weekly unemployment claims from the US, with an expected figure of 251,000.
Friday:
- The week finishes strong with the Prelim University of Michigan Consumer Sentiment from the US, anticipated at 65.5%.
Setups for This Week:
DAX
Primary View:
- The price created a head-and-shoulders pattern (yellow) and broke the neckline of this formation last week.
- The neckline lies on 15700 points (orange).
- The breakout of this neckline gives a sell signal.
- The price has already tested this level and confirmed it as resistance.
Alternative View:
- If the price climbs back above the orange area, it would provide a buy signal based on the false breakout.
 Dow Jones
Primary View:
- Dow Jones has created a double top formation (green) on crucial resistance at 34300 points (yellow).
- This pattern could signal negativity, but the price is still above the symmetric triangle marked with the blue color.
- If the price breaks the lower line of the triangle (which is an up-trend line), it will give us a sell signal.
Alternative View:
- If the price breaks through the 34300 points resistance, it would provide a legitimate, long-term signal to buy.
 WTI Oil
Primary View:
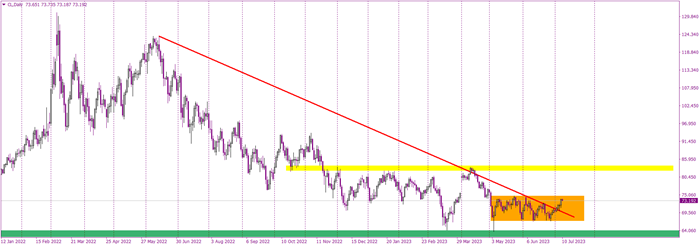
- Oil has been moving sideways since the beginning of May.
- Most recently, the price has climbed significantly higher and managed to break the long-term down-trend line (red).
- If the price breaks out of the sideways trend (orange) to the upside, it will trigger a buy signal.
Alternative View:
- If the price bounces off the upper line of the sideways trend, it will give us a signal to sell.
