Weekly Market Commentary | 18.12 – 24.12
18 December 2023

Curious to know what’s happening on the markets this week? Take a quick tour of the latest news, economic updates, and trading setups that will keep you up-to-date and in the know!
Monday:
- German IFO Business Climate: The only major release, expected at 87.6, will offer insights into Europe's largest economy’s business sentiment.
Tuesday:
- Reserve Bank of Australia Minutes: Insights into the central bank's policy discussions could sway the AUD.
- Bank of Japan's Statement and Rate Decision: While no change is expected, any hint of policy shift could jolt the JPY.
- Canadian Inflation Data: Forecast at a monthly drop of -0.2%, this release is crucial for CAD traders.
Wednesday:
- UK Inflation: Predicted to ease into 4.3%, potentially impacting the GBP movements.
- US Consumer Confidence: With expectations of 104.1, this piece of data will give us clues about the American consumer sentiment amidst inflationary pressures.
Thursday:
- US Final GDP: Anticipated at 5.2%, this key indicator will provide a clearer picture of the economic growth.
- Unemployment Claims: Expected to tick up to 215,000 & offering insights into the labor market.
- Canadian Retail Sales: A pulse check on Canada’s consumer spending.
Friday:
- UK Retail Sales: A 0.5% rise could signal strong consumer activity in the UK.
- Canadian GDP: Projected at 0.2%, a significant marker for economic health.
- U.S. Core PCE Price Index and Revised Consumer Sentiment: Wrapping up the week, these figures will provide a final glimpse into the U.S. economic landscape before the start of the holiday season.
Setups for This Week:
USDJPY
Primary View:
- The pair is currently forming a rising flag pattern, identifiable by parallel black lines.
- Given the preceding downtrend, this flag formation typically suggests a potential breakout to the downside.
- A break below the lower boundary of the flag could signal a selling opportunity.
Alternative View:
- If the price breaks above the upper boundary of the flag pattern, it could indicate a shift in momentum, favoring buying.
 EURJPY
Primary View:
- The EURJPY is trading within a symmetric triangle pattern, delineated by converging black lines.
- A breakout above the triangle can signal a move towards the green horizontal resistance, creating a buy opportunity.
Alternative View:
- Conversely, a downward breakout from the triangle pattern could trigger a sell signal.
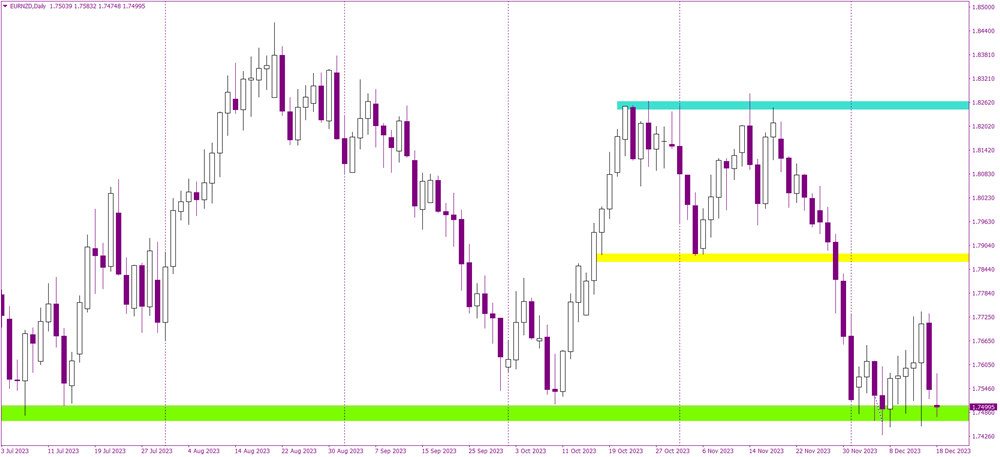
 EURNZD
Primary View:
- Currently, the EURNZD is testing the key horizontal support at 1.749, marked in green.
- A daily close below this support level would provide a strong indication for a sell trade.
Alternative View:
- Should the pair bounce off the support and form a bullish reversal pattern, it could give a cue to buy.
