US yields rose sharply again Monday, undermining precious metals. Both silver and gold came under selling pressure during the US session, with gold dropping 0.25 %, but silver lost nearly 1% and declined to 23.15 USD.
More importantly, silver has lost its 50-day moving average again, and it also fell back below the significant long-term bearish trend line, implying a possible weakness in the following days.
So far, the last week’s upside breakout above the bearish trend line appears like a bullish trap and a false breakout. That is usually a solid bearish reversal sign unless the price quickly climbs back above the trend line.
The following support could be at around 23 USD, where previous highs and lows are converged. Another demand zone might be located near 22.50 USD. That is the middle of the last consolidation area, where silver had already spent a couple of weeks.
Therefore, the short-term outlook does not look positive right now, and silver might continue lower.
Alternatively, if bulls reappear, they need to push silver above last week’s highs near 23.50 USD. Should silver close above this level on a daily chart, the medium-term outlook might change to bullish. However, there is another strong resistance and selling zone near 24 USD.
Overall, if the market continues to expect a more hawkish Fed, mainly due to the soaring inflation, it could send gold and silver below their current cycle lows.

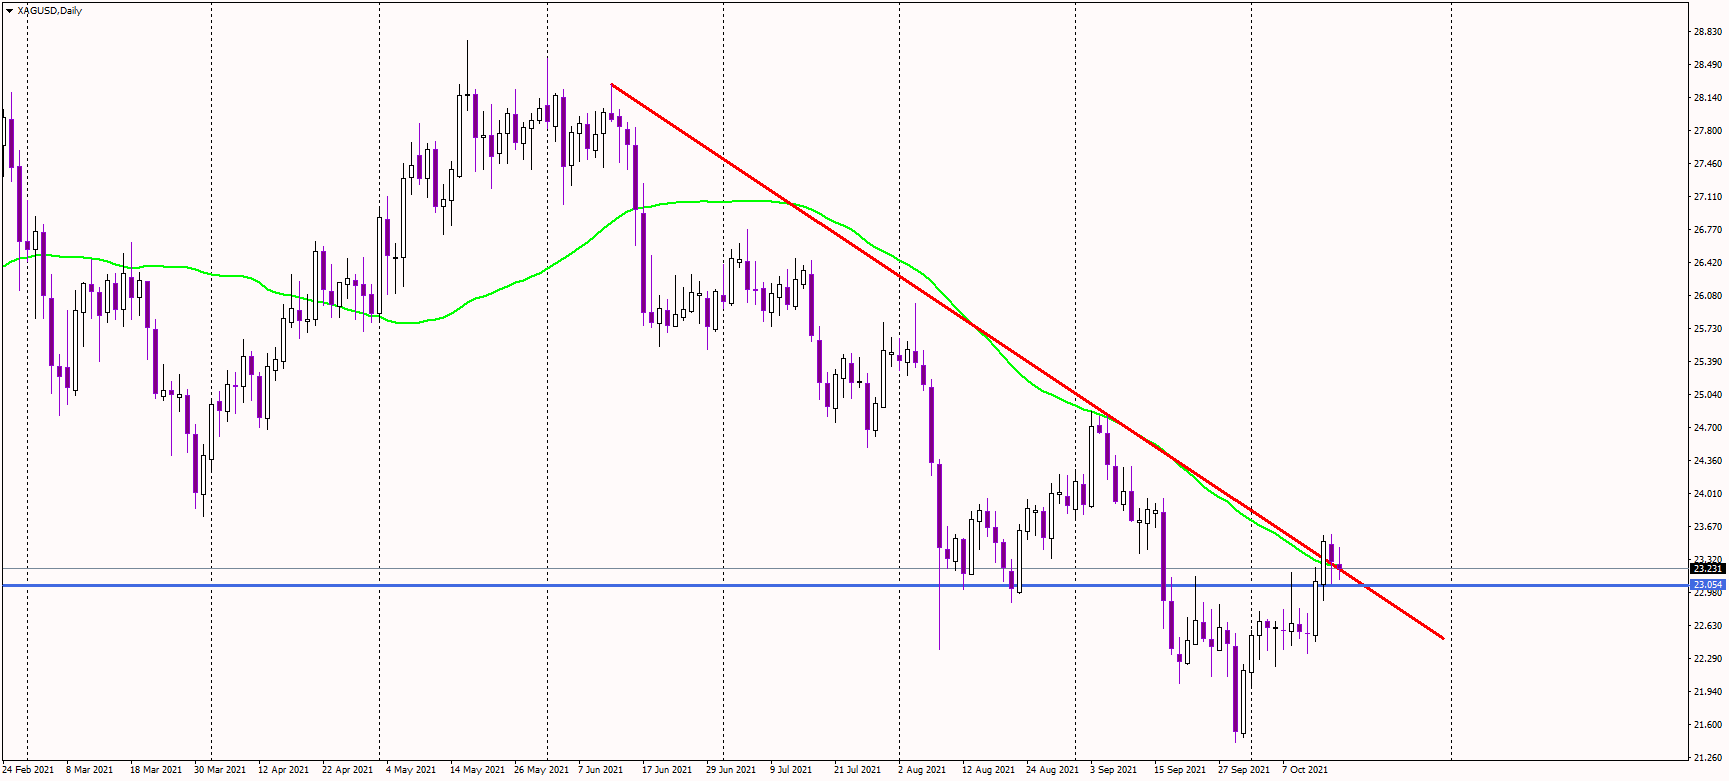
Silver Daily chart 3:15 PM CET