How to Read Stock Candlestick Charts
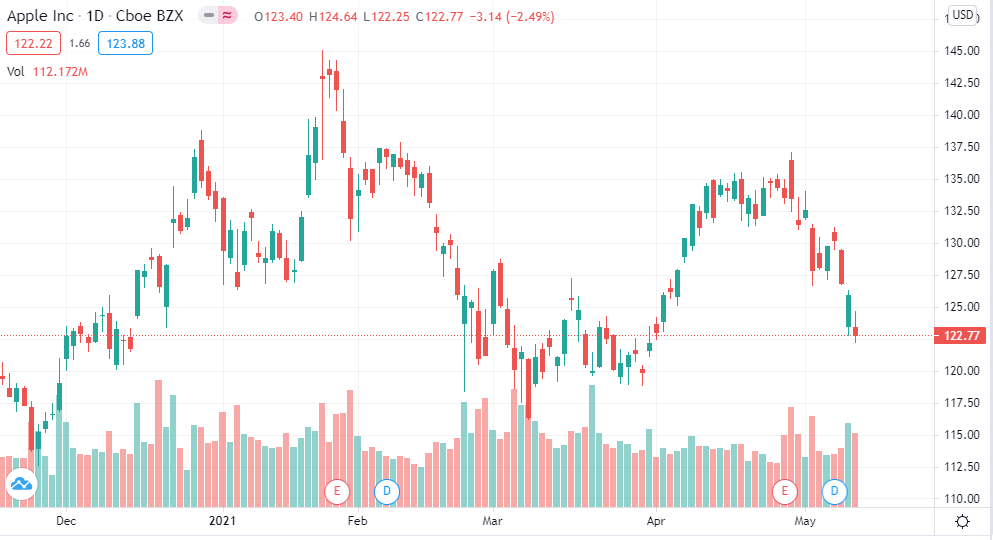
Understanding chart candlestick in stock trading allows investors to get more information about the marketplace, which then helps to make accurate predictions. Candlestick charts visually are similar to bar charts but contain a bit more information.
Firstly, stock candlestick charts consist of many rectangles. Each rectangle alternately is colored with two different colors, usually, the most used ones are green and red. The main part of the candlestick is known as the body. You can see on the candlestick a line that seems like a median and diversifies the body into two equal parts.
This line’s upper part is known as the upper shadow, while the lower one is called the lower shadow. For stock chart candlestick reading, it’s significant to know that through the body investors can define the first opening and the last closing for a specific time of period and high and low prices for a definite time. For example, if the candlestick chart is 5-minutes, this means that each candlestick shows information in each 5-minute interval. To make it more simple, imagine that there are two candlesticks colored green and red. The green body has shadows, as well, which are also called tails or wicks. Generally, the body is green if the trader can see the gain in a definite time interval. For example, if the upper part shows the opening and the lower part shows closing, if the wick, which comes from the rectangle’s upper side and is longer than the line which comes from the rectangle’s lower side, this means that the net price is positive, so a trader in this interval could find some gains. However, if the body is colored red this means that the reverse scenario occurred and the net price is negative.
To make reading a candlestick stock chart simpler, let’s discuss its parts one by one.
Open & Close Price
As already mentioned the candles represent the buying and selling of a stock in a certain time period. But, how do we know which part of the candle is open and which one is the close price? Let’s go back to the green and red candlestick example and say that the green body represents buying. That means it would open at the bottom of the body. So when the candle opens up right there buyers would have come in eventually and pushed it up above, which creates the green candle. The open and close locations of the candlestick will be determined based on which direction the price is going. If the price grows and closes higher than it opened, then the opening position will be at the button of the candlestick. The exact opposite happens when the price goes down. The open position will be at the top of the candlestick and the closing position will be at the bottom.
High & Low Price
The wick which is going higher and above from the candlestick body shows the change in high prices. The last point of the shadow estimates the highest price in a definite time period.
Imagine that the body opened up and pushed up at some point, but sellers pushed it down until it closed there. So that means, your bottom wick is going to be low. Hence, what probably happened was it opened up at the bottom of the body, and sellers tried to push it down so it turned red.
In the case of the red candle and according to stock charts candlestick patterns here’s what happened. It probably pushed up and turned green for a second and then sellers came back and said - “No, we're pushing this down”. Hence, they pushed it down and it pushed below the open price of the red candle and it dropped, and as soon as it did that it would have turned red. It dropped to a certain point no buyers came in to push it up. So it closed at that point at the end of that five-minute period, where the close price was at the lower price.
Price Direction & Range
Depending on the information which can be read through the candlestick chart, traders are allowed to define an asset’s price direction and range. Price direction on the chart is measured vertically with the use of the wicks or shadows. If the upper line is longer than the one which comes out of the body’s bottom side it means that the open price is below the close price.
Also, through the shadows and its technical analysis investors can find the most appropriate time for a specific asset to buy or sell. Depending on that information it’s easy for them to decide when it is worth buying an asset or selling it. Also, the price range varies between stocks and shares and can change at any time because of the volatile and liquid market.
Types of Candlesticks
There are several types of candlestick patterns. However, they are divided into two main categories - bullish and bearish. Those main categories have subcategories, as well. After a market downtrend, bullish trends can form, signaling a price pattern rebound. They are an indication for investors to consider opening a long position in order to benefit from an increasing trend. For example, bullish patterns are a hammer, inverse hammer, bullish engulfing, piercing line, the morning star.
In contrast with that, bearish candlestick patterns are formed after rapid price increases in the stock market and the following skepticism about the market price, which leads traders to close their long positions and open short positions to get high returns through the falling price. Bearish candlestick patterns are hanging man, shooting star, bearish engulfing.
Apart from that, there is a chart pattern which shows no changes in the market. Usually, those types of charts are called continuation candlestick patterns, and one of the most famous and used among them is known as Doji.
Shooting Star
Shooting star as already mentioned is one of the bearish pattern candlesticks. This pattern shows the increasing trend of an asset. To go back to the green and red candlesticks, let’s say that three green candles are shown in the chart, which shows the readiness of investors to pay more and more for the stock after realizing that they are overpaying for the asset the color of the candle body changes and becomes red, which means that the closing price is no longer more than the opening price. However, in this pattern, the red one followed by the three green bodies is called a shooting star, because it shows the highest price point in the chart.
Hammer
In contrast with the shooting star, the hammer is a bullish candlestick pattern. It is perfect for those traders who want to open a long position. It shows the time period when a certain asset starts a downtrend and indicates the point where the stock had the lowest price to buy. Usually, the hammer is followed by the three red bodies, that are showing a wide range in prices, and finally, the green one is the fact that traders decided that the price won’t go below an indicated price so they start buying it to open a long position and sell it more expensively to get money returns.
Bullish Engulfing
In the formation of a bullish engulfing pattern, it’s necessary to have two candlesticks - green and red. The main idea behind this pattern is that when the second day begins lower than the first, the bullish market drives the price higher, resulting in a clear success for consumers. The pattern is bullish engulfing when one of the candlesticks engulfs the second one fully and one’s length is higher than another’s. Bullish engulfing usually occurs at the end of a downtrend.
Bearish Engulfing
In contrast with the bullish engulfing the bearish one occurs in the chart when an asset’s price starts falling after a growing tendency. Generally, the bearish engulfing candlestick is followed by the trending candles that are usually green-colored and after the price starts decreasing the red-colored pattern appears in the chart which engulfs the previous green-colored candlestick. By this pattern, investors can observe the changes in the price movements and define an approximate peak of a stock price and the point where its price plummeted.
Doji
Doji pattern as already mentioned defines the condition when the prices are almost similar in the marketplace for a certain stock. In the case of the Doji pattern, traders can see that the candlesticks through the body and shadow are portraying the form of plus or cross. Depending on that form it’s easy to recognize a Doji pattern, which is considered as a neutral signal when there is no big difference between the buying and selling prices and therefore the net gain equals almost zero.