The Five Most Undervalued Stocks of 2026
Screening all stocks against these three metrics: low earnings multiple, support from the balance sheet, and healthy cash generation, means five names stand out.
One thing worth keeping in mind as we go: each of these stocks is cheap for a reason. The job isn't to find a low number and stop there, it's to ask whether the market's pessimism is pointing at a fixable problem or a permanent decline. That question is what separates a bargain from a value trap, and we'll keep coming back to it.
1. Volkswagen
If we sort the entire U.S. and European large-cap stock market list by forward earnings, Volkswagen sits right at the bottom, and it isn't particularly close. The stock trades at a P/E of roughly 7. The market is pricing one of the largest carmakers on the planet (the owner of Audi, Porsche, Škoda and Lamborghini) as though its profits are about to be permanently impaired.
The reason isn't a mystery. Volkswagen is caught between aggressive Chinese EV competitors eating into its markets. On top of that, the cash flow test shows that free cash flow has been thin and volatile, at times turning negative, meaning the company has at points been spending more cash than what operations (selling cars) bring in. This shows up in a free cash flow yield of only around 1%.
These downsides don't necessarily make it a value trap however, as these are investments being made specifically to combat the risk of Chinese EVs. This is where your own insight comes in, are you convinced that Volkswagen will be able to overcome this threat and turn the current investments into future profits? If so, this is a value stock with solid growth potential.
2. Mercedes-Benz
Mercedes-Benz trades at a forward P/E of around 9, but the figure that catches the eye is its price-to-book of roughly 0.65. As we discussed earlier, a P/B below 1 means you're being offered the company for less than the stated value of its own net assets, meaning that you could theoretically buy out the company and strip it apart to make money.
Where this gets interesting is the comparison with Volkswagen. Where VW stumbles on the cash test, Mercedes holds up far better: with a free cash flow yield of around 4%, it generates several times the cash relative to its size that Volkswagen does, which tells us the cheap valuation is backed by real money coming through the door, not just an optimistic reading of the books. On a relative basis it trades at roughly 9 times earnings against a global auto industry average closer to 17.
It carries the same China and tariff overhang as Volkswagen, so this is no free lunch. But among the cheap automakers, Mercedes pairs the stronger brand and the better margins with the healthier cash position, arguably making it an even better option than Volkswagen.
3. Citigroup
Banks have re-rated sharply over the past year, and most of them are no longer cheap. Citigroup might be the exception. Even after a strong run, it trades at a forward P/E of around 11 and still sits at roughly its book value, which gives us that asset-backed cushion underneath the price.
A quick note on method here, because banks don't quite play by the same rules. The free cash flow test we leaned on for the other names doesn't translate cleanly to a bank, since lending, deposits and regulatory capital make their cash flows work very differently. For banks, the more telling gauge is return on equity, essentially, how much profit they earn for every dollar shareholders invest. Citi's ROE still trails its peers, and that lower number reflects why the stock is cheap, but it also means every step Citi takes toward peer-level returns helps justify a higher valuation, making it an interesting play while this catch-up has not yet been completed.
4. Barclays
If Citigroup is the cheap American bank, Barclays is its European counterpart, and on the raw numbers it's even cheaper with a forward P/E at 7.4. Like Citi, it continues to trade below its tangible book value despite a solid recovery.
The discount reflects a familiar set of worries: general skepticism toward UK and European banks, and the hard-to-forecast earnings of its investment-banking arm. Those concerns are fair. But the business underneath has been steadily improving, with returns now approaching double digits, and it pairs neatly with Citigroup as a second turnaround-bank story.
5. Pfizer
Our final name brings some welcome diversification, because a list made up purely of carmakers and banks would be leaning very hard on just two stories.
Pfizer's trailing P/E looks unremarkable at around 19 to 20, but that figure is distorted by the post-pandemic earnings comparison it's still working through. The forward P/E sits closer to 9. The real selling point, however, is its free cash flow yield of roughly 7%. The company is building a strong cash position, allowing it to either reinvest these profits into new research or distribute it to shareholders, both scenarios which generally help stocks to go up. However, there is also a reason the stock is this cheap, as the market rarely gives a free lunch. Several of Pfizer's most important patents are set to expire in the coming years, allowing competitors to make the same medication, and thus strongly diminishing expected revenue. But that strong cash generation, combined with a generous dividend, suggests a lot of the pessimism is already reflected in the price.
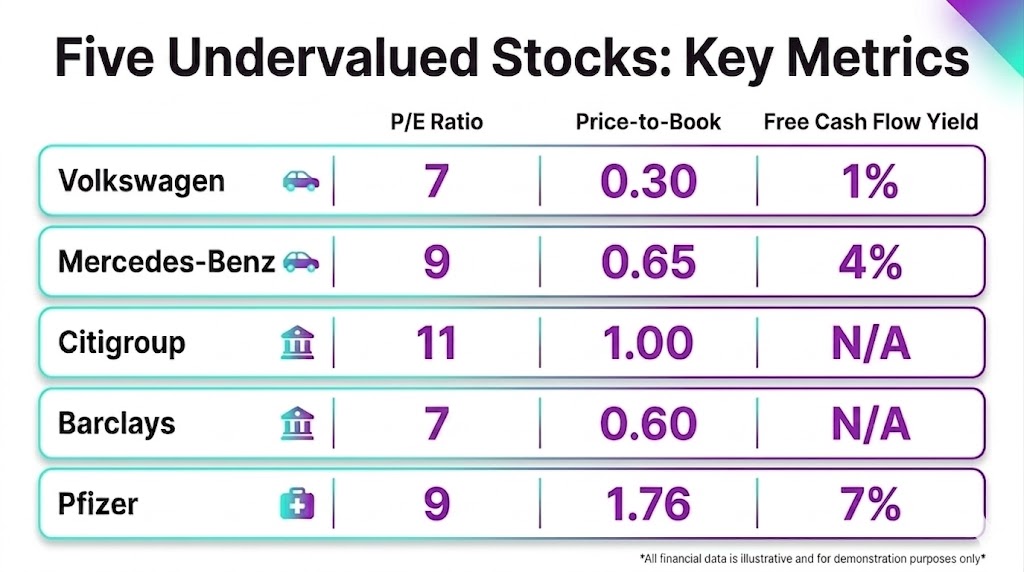
Comparison table showing P/E, price-to-book and free cash flow yield for five undervalued stocks
Why Are These Stocks So Cheap?
It would be easy to read the five names above as five separate ideas. What we really have is three underlying stories: that the market is too pessimistic on legacy automakers facing Chinese competition (Volkswagen and Mercedes), that two restructuring banks will close the gap on their peers (Citigroup and Barclays), and that Pfizer's cash generation can carry it through its patent cliff.
That matters for how we think about risk. Volkswagen and Mercedes will tend to move together on any China headline, just as Citigroup and Barclays will react to the same shifts in the rate and credit cycle. So, while we have five tickers, we're really making three bets, and any position sizing must account for those overlaps rather than mistaking them for true diversification.
And to come back to where we started: in every one of these cases, the cheap valuation is there for a reason. The low multiple is the market telling us about a real risk, not handing us a guaranteed bargain. Value investing works over the long run precisely because it asks us to sit with that discomfort while we wait for the story to change, and to accept that sometimes the story doesn't change at all.
How Can You Research Value Stocks Yourself?
The framework above is repeatable. Start by screening for a low P/E, then sanity-check it against price-to-book and free cash flow yield. After that comes the hard part: asking whether the market's fear concerns a fixable problem or a permanent decline. Reading earnings reports, tracking sector news, and understanding the macro backdrop all feed into that judgment. Our Weekly Market Pulse and Trading Academy are good places to keep building that context.
Conclusion
Value hasn't disappeared in 2026, it has simply moved to the corners of the market that everyone else is avoiding: out-of-favor European automakers, restructuring banks, and a pharma giant staring down a patent cliff. None of these are comfortable stories to own, which is exactly why they seem cheap in the first place. Whether that discomfort turns into profit depends, as always, on whether the market's fears prove overdone or well-founded, and that's a judgment each of us has to make on our own.