One Minute Forex Strategies listed and explained
Before we explain the five trading strategies for a 1-minute timeframe, there are a few considerations. First of all, the risk-to-reward ratio should be around 1:1, 1:1.5. This is because when trading in the 1-minute timeframe, traders typically use scalping strategies to quickly make profits from short-term movements. Scalping strategies offer higher win rates that can sometimes reach 80%-s levels. Entering and exiting positions quickly is the key characteristic of scalping strategies, and small profit targets can help reduce exposure to market risks while simultaneously increasing the win rate. Market conditions often change, and strategies that were making money become losers. We advise every trader to backtest all the strategies they will find online at least 100 trades before putting them into practice on the live accounts. While these strategies are working now, we can not guarantee that they maintain their performance in the long term without making some adjustments and tweaks.
Strategy 1: Hull Suite and ADX and DI TradingView custom indicators
Indicator 1: Hull suite (default settings, leave untouched)
Indicator 2: ADX and Di (ADX indicator, only +di and - di is used)
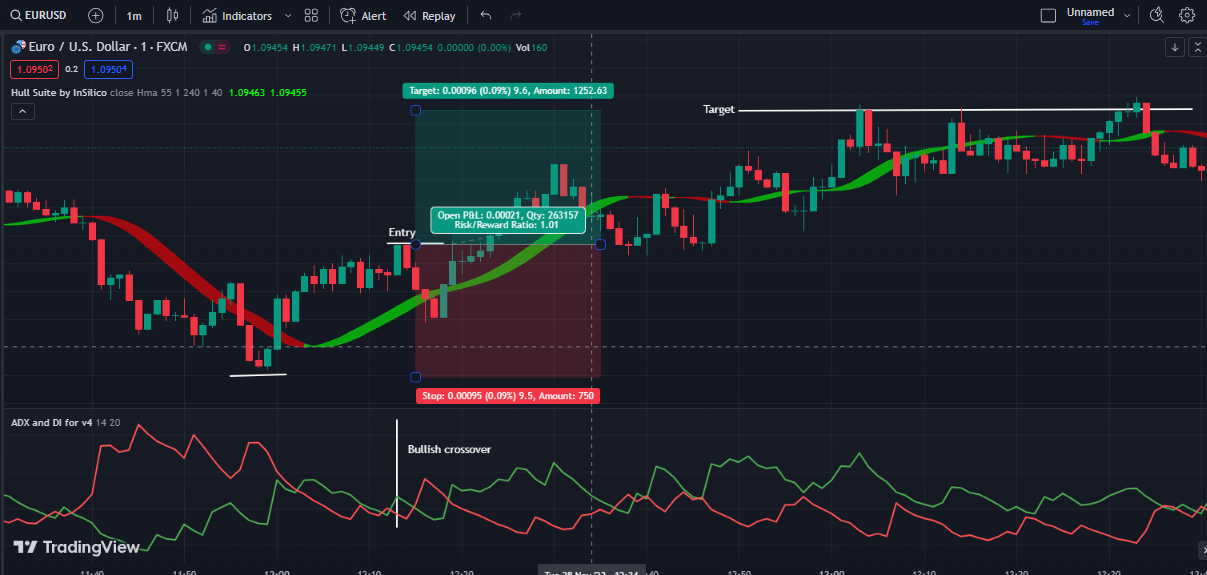
With this simple yet effective strategy, we are going to define the main trend direction using the Hull suite moving average and enter positions when ADX + Di and - Di cross happen.
Both indicators are easy to search and use on the TradingView supercharts. These indicators are also available for MT4, MT5, and cTrader depending on the trader’s preferred trading platform. We will use the hull suite with unchanged settings and will tweak the ADX and Di indicators to make them more visible and clear. Head to the settings of the ADX and Di and mark the following:
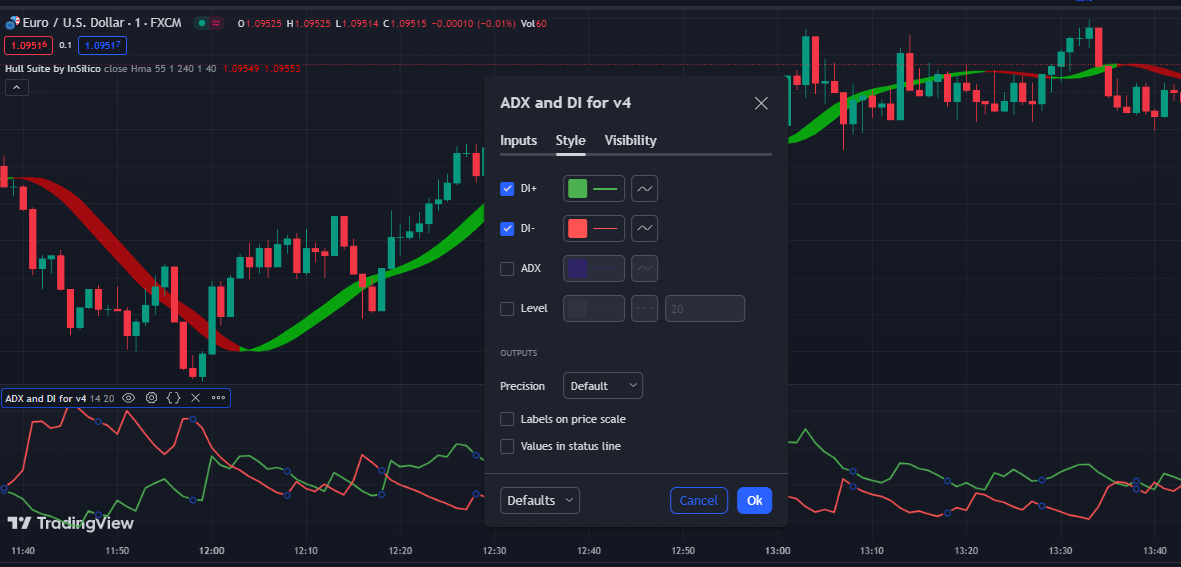
Mark only Di + and Di - to be shown on the indicator window.
We are ready to explain the main rules for entry and exit. When the +Di crosses -Di and the Hull suite is green, we buy the asset. There are several ways to use stop loss, but we will use a recent swing for this strategy. Place the stop loss slightly below the recent lower low price swing to be protected from small fluctuations. Target the 1 to 1.5 times the size of the stop loss, meaning if the stop loss is 6 pips away you can place the take profit at 6 pips or 9 pips away from the entry price. While it is possible to use a 1.5 risk-to-reward ratio, 1:1 is the best for catching as many profitable trades as possible, increasing the win rate in the end.
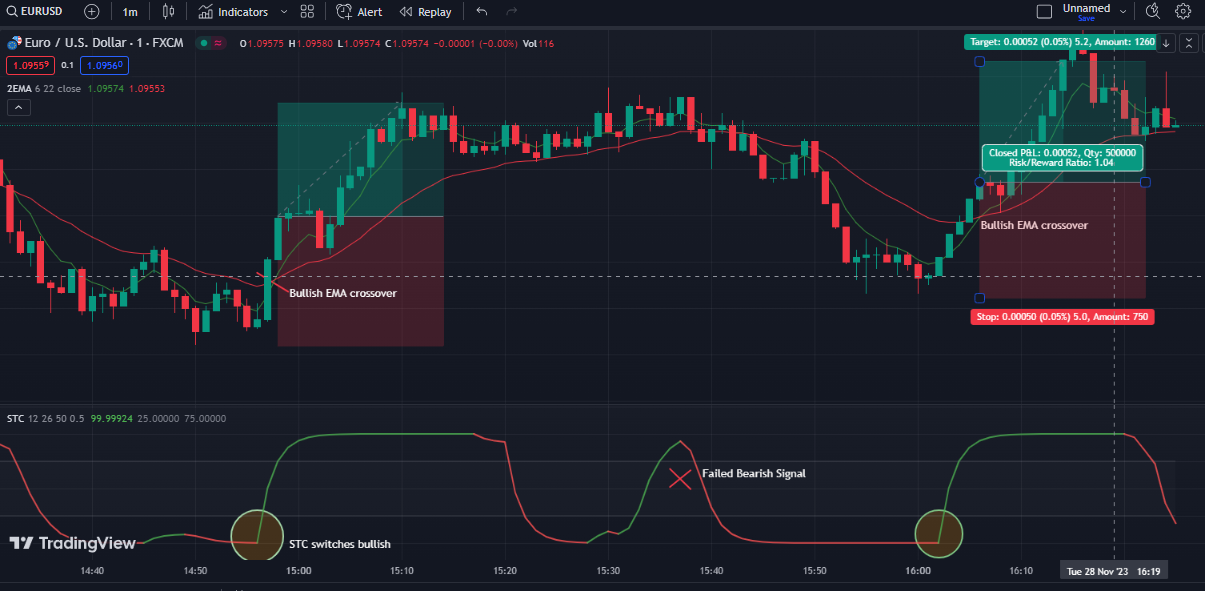
Strategy 2: Schaff Trend Cycle (STC) and Double EMA crossover strategy
Indicator 1: STC indicator (any colored or uncolored will work)
Indicator 2: 6-period exponential moving average (fast EMA)
Indicator 3: 22-period exponential moving average (slow EMA)
This 1-minute scalping strategy uses two moving average crossover and filters signals with the Schaff Trend Cycle (STC) indicator. While the majority of the moving average crossover strategies lose money, this method incorporates a clever filter signal using the STC indicator. STC is a cycle indicator that is very robust, and it can help filter the majority of false moving average crossover signals. The STC indicator is an oscillator that varies between 0 and 100 and in our case it also changes the color based on the trend direction. We want it to touch these levels and reverse before we can use it as the filtering signal. What we want to see is that STC touches 0 and then reverses, and the Exponential Moving average crossover also follows in the bullish direction. The moving averages we use are the 6-period exponential moving average (fast) and a 22-period moving average also exponential (slow). This scalping strategy is developed to catch the changing cycles in the markets and can be used in almost any trading asset class. We use all of our strategies for Forex trading, but traders are free to test them on other assets such as Gold, cryptos, etc. Our risk to reward is 1:1 to increase the win rate, a.k.a. the number of profitable trades when compared to losers.
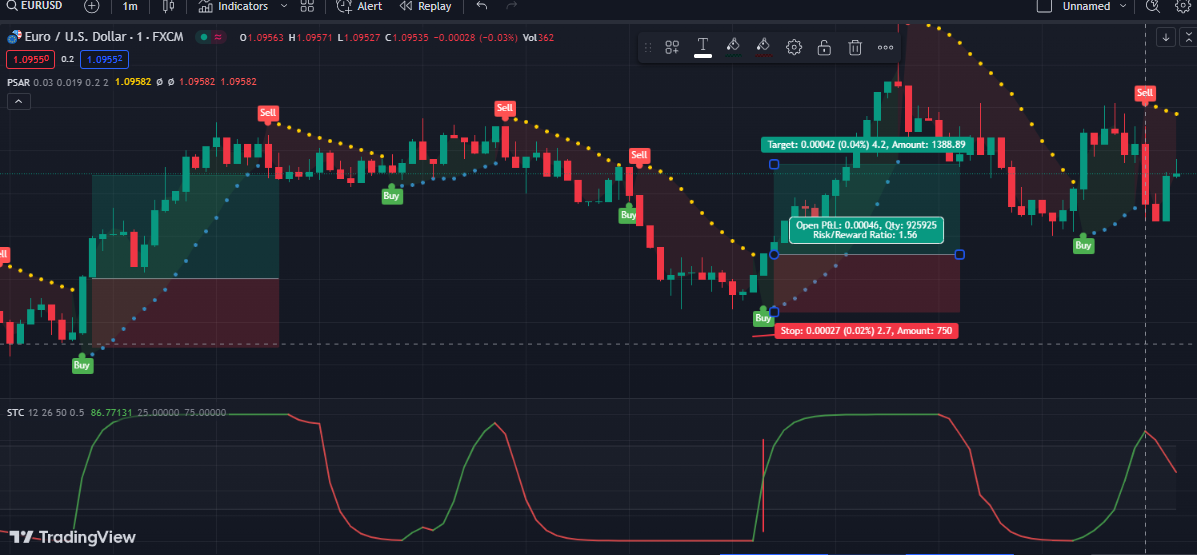
Strategy 3: Parabolic Sar and Schaff Trend Cycle (STC) scalping strategy
Indicator 1: Indicator 1: STC indicator (any colored or uncolored will work)
Indicator 2: Parabolic Sar (by everget, modified settings: 0.03, 0.019, 0.2, 2)
This strategy also uses STC with a similar method: we wait until the STC indicator touches either 0 or 100 levels and then change direction. When this happens we have a signal, buy when STC switches from 0 to upside and sell when it changes direction from 100 level to downside. This is super important to filter false signals. The Parabolic Sar indicator we use is a popular one by everget that provides buy and sell signals when the dots change direction. You can also use default Parabolic Sar and wait for dots to change from bullish to bearish. When the STC signal is bullish (buy) and parabolic Sar also prints the buy signal, we enter the position. The opposite is true for sell signals. The critical part is STC must switch direction first and Parabolic Sar signal should follow. This method is so robust that traders can use a 1:1.5 risk-to-reward ratio, meaning they can set take profit at 1.5 times the size of the stop loss length.
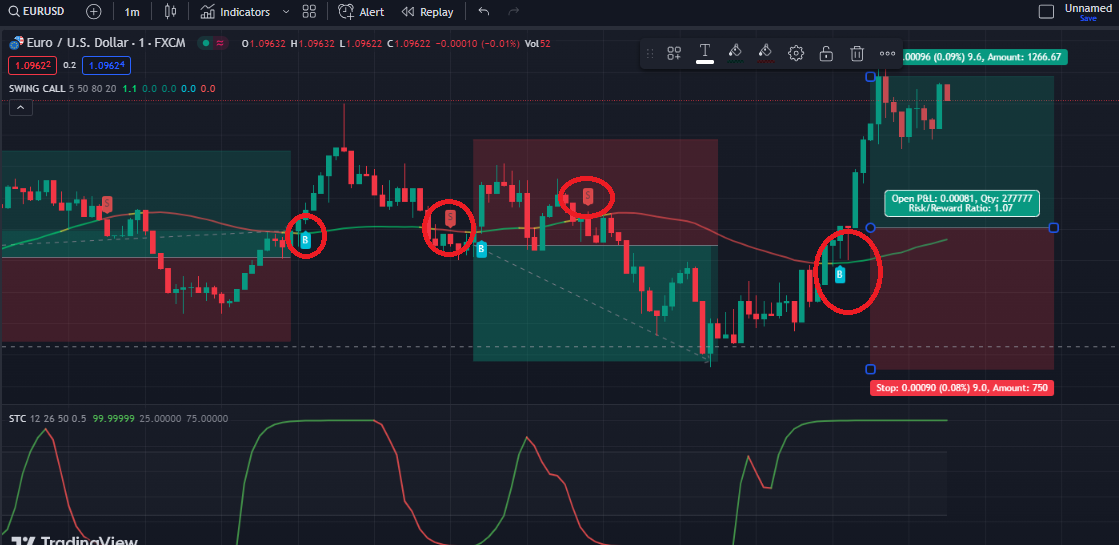
Strategy 4: Swing Trade Signals and STC Indicator Scalping
Indicator 1: Swing Trade Signals (by nicks1008, default settings)
Indicator 2: Schaff Trend Cycle (STC) oscillator (default settings, any version)
In the earlier examples, we were mostly targeting 1:1 risk-to-reward, meaning we would set stop loss exactly at the same distance as stop loss. In this case, we can have an even lower risk-reward ratio of 1:0.8. This way we will quickly scalp every successful signal and filter bad signals using the STC indicator.

The rules for entering the buy trade are simple: when the swing trade signals indicator prints the buy “B” or buy signal and the STC indicator is green, we open a buy trade. Stop loss is set at the recent swing low, just below the body of the lowest candle, and target 1 or the 0.8 times stop loss. The complete opposite is true for sell signals. This is a very simple strategy that can help quickly scalp the market for extremely short profits. Although we have tested this strategy, we advise you to test it yourself on at least 100 trades to have a decent understanding of its mechanics and performance.
Strategy 5: Trend Meter and Hull Suite scalping Strategy
Indicator 1: Hull Suite (default settings)
Indicator 2: Trend Meter (default settings)
These two powerful indicators can work wonders when combined. The Trend Meter indicator issues many good signals, but there are many bad ones as well. To filter out these bad signals we can use the Hull Suite which shows the current trend direction. When the Trend Meter prints a “+” sign that is in the color of the Hull Suite, or in the direction where the Hull Suite is indicating we enter a trade. One important rule is to open only one trade in the same direction despite how many signals the Trend Meter prints. In our case, we enter the sell position from the first red-colored “+” signal as it is aligned with the Hull Suite. However, we miss all the following signals in the same direction to avoid catching ourselves off-guard when the trend switches.
Set stop loss on the recent swing low for a buy trade and on the recent swing high for a sell trade. Target 1 times the risk, or the distance of stop loss.
How to build effective one minute trading strategies - A beginner’s guide
Here is a short list of techniques a trader can use for building his or her Forex 1-minute trade strategy:
- Choosing brokers with tight spreads and no commissions
- Executing trades manually
- Setting profit target 2 or 3 times higher than the risked amount
- Using 50 and 100-period exponential moving averages
- Using Heiken Ashi candlesticks
Let us go through each of those methods in more detail.
Choosing the right broker
Before moving on to the exact methods, it is important to mention that before traders start using one-minute strategies for Forex, it might be useful to consider broker expenses. Firstly, it is important to avoid high commissions. Some providers do charge a $5 or $10 fee for trading 1 lot, which is the equivalent of 100,000 units of a given currency.
The successful Forex strategy on the 1-minute timeframe relies on dozens of trades per day. Therefore, those types of expenses can easily add up to an extent where a trader could be spending $100 to $500 just in commissions, which can significantly reduce his or her potential payouts. Fortunately, there are plenty of brokers who do not charge commissions for trading.
Another major consideration here is the size of the spreads. For such a short timeframe as 1 minute, a trader might be only aiming at 5 or 10 pip gain, therefore brokers having tight spreads is essential for success in this style of trading.
Here it might also be helpful to point out that most liquid major currency pairs typically have better spreads, than their less famous counterparts. Consequently, market participants, using one-minute strategies for FX, traders might consider executing most of their trades with the most popular pairs.
Avoiding the use of stop-loss and take-profit orders
In scalping, every second is important, especially when it comes to trading with a 1-minute timeframe. Consequently, the majority of professional traders usually prefer to execute both buy and sell orders manually, instead of wasting some precious seconds on preparing stop-loss or take profit orders.
The only exception to this rule is the time during the major economic announcements. Some traders might choose to avoid trading at those points altogether. However, those who open positions during important news releases do place stop-loss orders, as an insurance policy against potential losses. In highly volatile market conditions such as news announcements, stop loss placement should be a part of your 1 minute Forex strategy.
Setting the appropriate profit and loss ratio
Many Forex traders believe that achieving more than 50% of winning trades is highly important for building a successful trading career. However, there can be no guarantee that an individual can always achieve this, especially when it comes to such a high stressed environment, such as 1-minute trading. Trading setup dictates risk to reward ratio. You can simply make a decision whether to open a position or not.
However, there is one simple way to improve the odds of success. For example, a trader can aim for a 10 pip gain for each position and at the same time limit losses to 5 pips. Clearly it does not always have to be 2:1 ratio. For example, a market participant can have a goal of winning 9 pips from every trade and put close positions at 3 pip loss.
This approach enables traders to earn decent payouts even in cases where the winning rate of their trades is only 45% or 40%. Your 1 minute chart trading strategy should give you a trading edge in order to increase your trading balance gradually.
Utilizing exponential moving averages
Choosing the best indicators for 1 minute chart is not easy. Certain indicators work best in certain market conditions. One of the best indicator for 1 minute scalping is EMA, as the indicator puts an emphasis on recent price changes. Markets can be trending or ranging. One of the most popular 1-minute strategies is the use of the traditional candlestick charts in conjunction with 3 technical indicators. The first two of them are the 50-day exponential moving average (EMA) and 100-day EMA. This is meant to help a trader with trend identification.
If the current price is higher than exponential moving averages, that could suggest that the given currency pair is in an uptrend. If the 50-day EMA crosses and moves above 100-day EMA, this can be another important bullish sign. The opposite is also true if a 50-day exponential moving average crosses and goes below its 100-day counterpart, this is usually considered as a bearish signal.
The third final component of this analysis is the stochastic oscillator, that produces reliable trading signals in ranging markets. This indicator is measured as a number, which can range anywhere from 0 to 100. Simply put, if this measure is 80 or higher, this might suggest that the recent move upwards was too strong and the market is likely to experience some pullbacks and corrections. At the same time if the stochastic oscillator is 20 or lower, then this might be a sign that a recent downward move had too much strength and the given currency pair might recover in the short term.
In order to see how those indicators can work together, let us take a look at this
1-minute EUR/JPY chart:
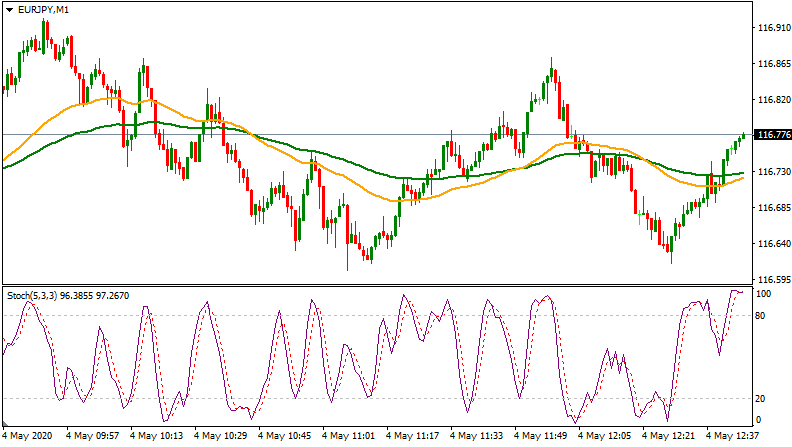
As we can see from the above, the Euro was rising against the Japanese yen, however, at the same time, the stochastic oscillator was well above 80, which pointed at the fact that the correction was likely. Sure enough, the single currency fell significantly, with the 50-day EMA crossing below the 100-day exponential moving average, which was another bearish sign.
This downtrend continued for some time until the Euro was able to turn the tide and once more return close to the previous high levels. Here again, the stochastic oscillator reached extremely high levels, which was followed by pullbacks.
As we can see from this chart, this time the Euro is rising once more, trading well above the 50-day and 100-day exponential moving averages. There is one concern, however, the stochastic oscillator now is nearly at 100, which suggests that this recent upswing was too strong and we might expect some pullbacks.
Therefore, from this example, we can see that those 3 indicators used together can help traders not only to identify the latest trends, but also to predict the possible reversals as well. However, just like any other Forex strategy, using this method can not guarantee a 100% success rate, there can be other factors in play, which can substantially alter otherwise predictable patterns.
EMAs are trend trading indicators while oscilators help trade ranges. Using these in combination might help short term traders increase their chances by trading in the trend direction. Choosing the best EMA for 1 minute chart can be a challenge, however, you can experiment and see what works for you best.
Using Heiken Ashi candlesticks for quick technical analysis
Another simple, yet potentially effective 1-minute strategy could evolve around the Heiken Ashi charts. This might be very beneficial for those traders who are not comfortable with analyzing several different indicators in such a short period of time. Powerful 1 min scalping system can include Heiken Ashi, as it filters out market noice and makes trend trading easier.
On the other hand, the Japanese candlesticks speak for themselves in terms of showing the latest trends and even potential reversals. In order to illustrate this let us take a look at this 1-minute GBP/JPY chart:
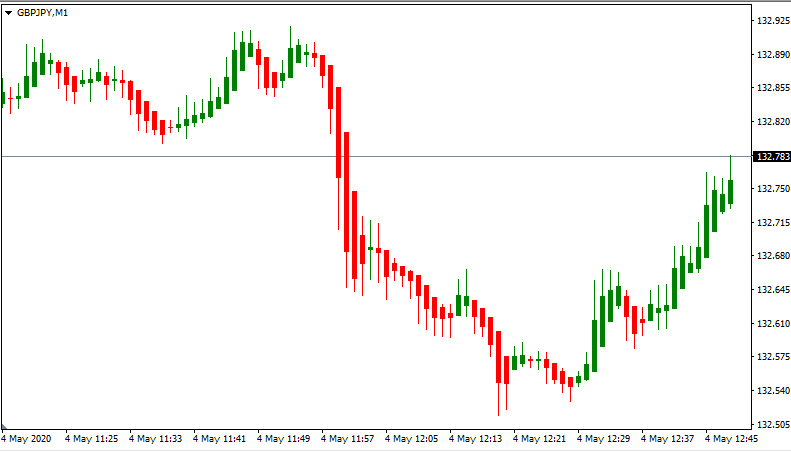
As we can see from this chart, the GBP/JPY pair moved sideways for a while, until moving on to quite a lengthy downtrend in the middle. This large move was sometimes interrupted by very short green candlesticks, however, the overall direction of the market remained intact.
It was only at the end of the chart, where we can see several longer green candles, which signaled a reversal and the pair regained roughly two-third of its position.
As we can see, there were some individual points in this chart, where it was a bit tricky to correctly guess the trend, however, most of the time it was quite obvious. This is not as much of an issue since trades do not need to have 100% winning trades in order to succeed. In most cases having more than 50% is quite enough.
Despite those arguments and all of the advantages of using Heiken Ashi candlesticks, there can be some scenarios where traders might get confused with mixed signals. To see one example of this, let us take a look at this
1-minute EUR/USD chart:
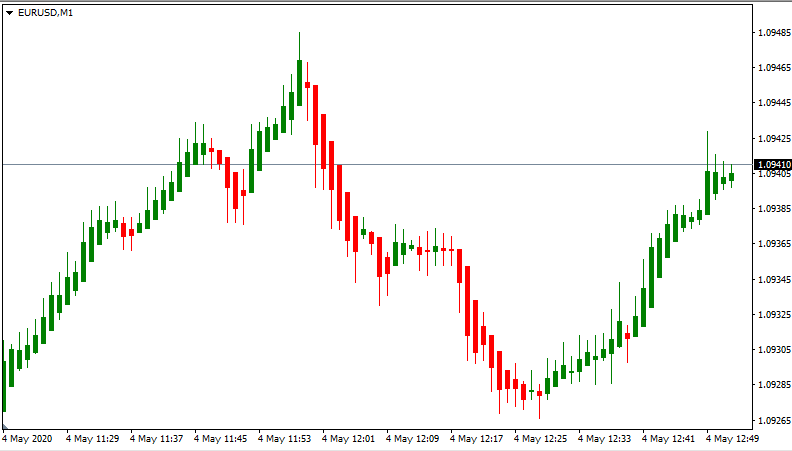
Here just like in the previous chart, we can see that most of the time trends are well defined, basically, during this period the Euro had experienced 2 uptrends and 1 downtrend.
However, there are points, where traders could potentially run into problems. Just to bring one example, the first upward trend was interrupted by 5 red candlesticks in a row. In fact, the 3rd and 4th candle seems quite solid, so some traders might have concluded that this was a sign of reversal, however, later the old trend resumed.
So, therefore, we might conclude that the Heiken Ashi charts can certainly help traders to improve the ratio of winning trades, but it can not always be a guarantee of success. Heiken Ashi simply makes price moves more visible with less market noise. Best 1 minute strategy for Forex should include rules for following local and general trends in order to increase success probability.