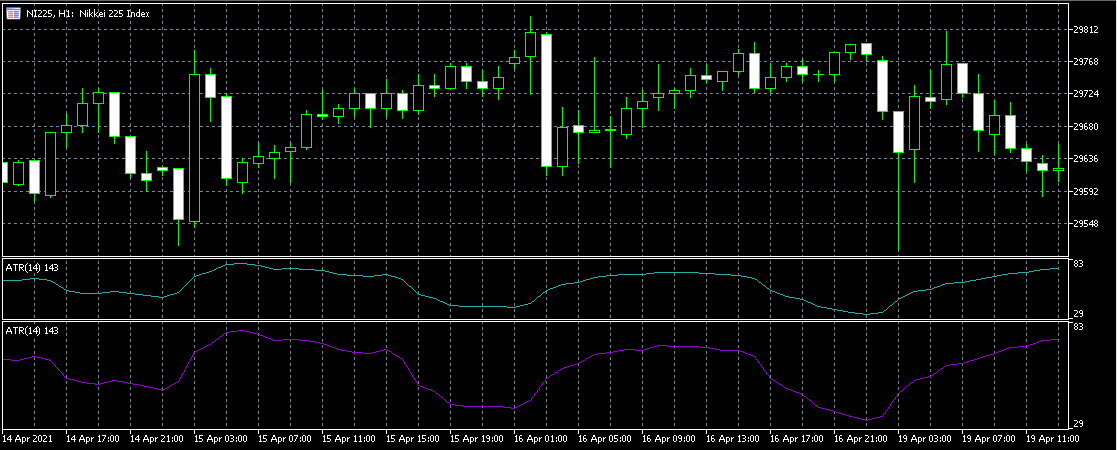
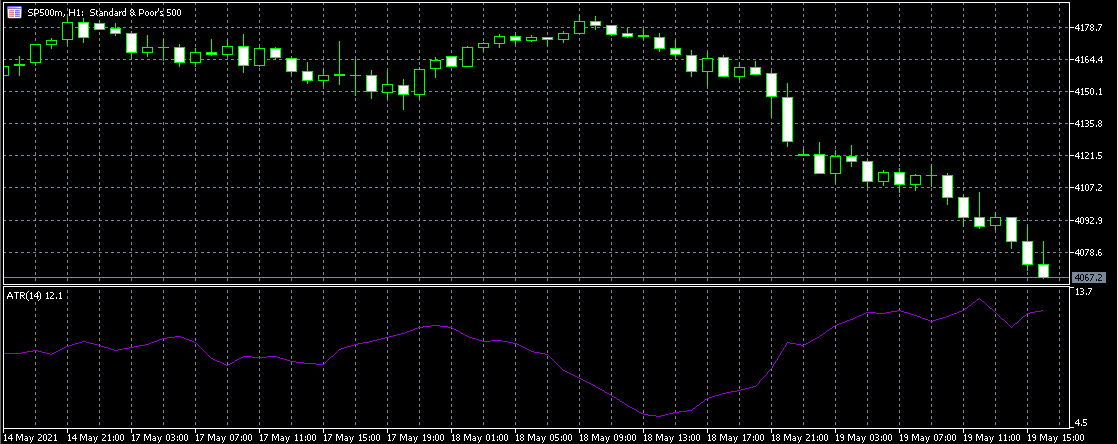
ATR Indicator for Stocks - Example
To make it more simple how to use ATR indicators in the stock market, let’s take an example.
Imagine, that a particular stock’s data looks like this:
- Monday - H = $13, L = $9 and Cp = $11
- Tuesday - H = $12, L = $8 and Cp = $10
- Wednesday - H = $15, L = $11 and Cp = $14
- Thursday - H = $21, L = $17 and Cp = $20
- Friday - H = $19, L = $15 and Cp = $18
Let’s calculate all of them with the use of those above-given three formulas. Firstly, use the H - L = TR formula.

In this case, TR for each weekday equals $4. After that, you need to sum all of them so SUM (TR) is $20. Then you should use the formula SUM(TR)/N. As the number of days is 5, you need to divide $20 by 5. So, the Average True Range for this stock equals $4.
Let’s use the second formula to calculate Average True Range stock - |H - Cp| = TR. In this case, TR for Monday and Tuesday equals $2, while for other weekdays it is equal to $1. After summing them up the total TR for the stock during 5 days is $2+$2+$1+$1+$1, which is $7. After that, you should divide this ratio by 5, the number of weekdays, which is 7/5, or $1.4.
Now, we can use the third formula, as well. In this case, the ratio for Monday and Tuesday equals -2 USD, for other weekdays it equals -3 USD. After summing them up, -13 USD. Then we need to divide -13 USD by 5, the number of total days. So in this case ATR for the company equals -13/5 USD or -2.6 USD.
What Does the Average True Range of a Stock Show Us?
To put it simply, the Average True Range in the stock market shows a certain asset’s volatility. If the ratio of ATR is high, this means that a stock is highly volatile, while, in contrast with that, if the ratio of ATR is lower, the asset is characterized by lower volatility. The rise and fall of the ATR index are dependent on price changes. For example, if the price increases, the index of the ATR is increasing as well, and in contrast with that, if the stock price falls the ratio of the ATR decreases respectively.
With each passing time interval, a new ATR reading is computed. Per moment, a new ATR reading is measured on a one-minute table. Every day, a new ATR is measured on a regular table. All of these indicators are placed together to form a continuous graph, allowing shareholders to see if variance has evolved over time. There is no difference between the number being negative or positive. The main thing is the ratio which is shown by ATR formulas, as for defining the Average True Range of stock, you need to be focused on absolute value.
Day traders may use the ATR for defining the profit goals in the stock market. Day traders may use statistics about how fast stock usually changes in a given timeframe to determine benefit goals and decide whether or not it will enter a deal. Suppose that on average, a stock passes $1 a day. There is no major news to report, but the stock is up to $1.11 for the day. The trading range, suppose that is $1.31 (high minus low).
The market has now moved 31% faster than normal, and you already have a purchase signal from a company. The buy signal may be real, but given that now the market has indeed jumped considerably higher than expected, betting on the price continuing to rise and extending the spread any further may not be a wise choice. The trading would be against the possibilities.
Since the price has now risen significantly and moved beyond the median, according to the stock trading Average True Range it will be more likely to decline and remain within the previously defined price point. If purchasing while the price is at the top of the regular range—and the range is well above average is obviously not a smart idea, selling or shorting is probably a good choice, assuming a legitimate sell signal exists.
Depending on the example, we can say that it wouldn’t be a good idea to sell the stocks or go short. The main thing is that the signal may not indicate the real forecast in the stock market, so you should wait for the valid signal, in order to make your trading more effective and avoid the losses of your funds.
The scenario can be reversed depending on the ATR indicator in the stock trading. This most probably happens if the stock price falls and the asset value range is higher than average. In this case, some investors or signals may advise you that it’s the best decision to sell your asset, however, this signal may be invalid, which means you should ignore these signals and wait for the situation to become more steady. It is more likely that the price, depending on the law of demand and supply, will go back to the original price. So, in order to make your trading more efficient, you need to wait for the signals that are suitable for your generated strategy.

The ATR was originally created for commodities, but it can also be used for stocks and indexes. ATR indicators for stocks can be used in several ways and for determining several things that occur in the stock marketplace. Simply stated, a stock with a high level of volatility has a higher ATR, whereas a stock with a low level of fluctuation has a lower ATR. Market investors, who are good at technical analysis may use the ATR to join and leave markets, and it is a handy instrument to use in a market situation.
It was designed to allow traders to more accurately calculate an investment's regular movement through basic calculations. The metric does not signify price trends, instead, it is used to quantify uncertainty created by differences and to restrict up or down movements. The ATR is a simple calculation that requires only historical price details.
However, you should consider that it is always a good idea to observe the past price changes in the stock market. The analysis of historical data allows investors to determine what price movements are most supposedly to take place in the market. Moreover, the stock trading Average True Range can be used as an exit method.
One of the most popular ways to determine what is the best time to exit from the market is developed by Chuck Lebaue and is called “chandelier exit”. The chandelier exit puts a trailing stop below the stock's highest peak since you joined the exchange. The interval between the maximum high and the stop level is expressed as a multiple of the ATR.
The ATR will also help a trader decide what size deal to enter in the derivatives industry. The ATR approach to position sizing can be used to account for an individual trader's ability to tolerate risk as well as the fluctuations of the underlying sector.
How the ATR Indicator Lowers Risk
The ATR indicator in the stock market allows traders to lower the risks of trading in the marketplace. Through this indicator, they are able to avoid losing funds. A trailing stop loss is a method of exiting a trade if the commodity price moves against investors, but it also allows people to shift the exit point if the price moves in their desired way. Mostly, the ATR indicator is used by those investors who want to determine the point where there will be their trailing stop.
Examine the latest ATR reading at the time of a transaction. A good rule of thumb is to multiply the ATR by two to find a suitable stop loss point. In case you are going to buy an asset, you might set a stop loss at twice the ATR below the entry price. If you're going to short a share, you'd set your stop loss at twice the ATR above the entry price.
If you're long and the market moves in your favor, keep moving your stop loss to twice the ATR below the price. In this case, the stop failure will only go forward, never down. Once moving up, it remains there before it can be actually moved once, or the sale is closed as a result of the market falling to the trailing stop loss mark. The same procedure applies to short deals, except that the stop loss just travels downward.