What are Forex Bulls and Bears Indicators?

Among lots of different technical indicators, there are bears power and bulls power indicators that help traders better digest market information. The two indicators combined are known as the Elder-Ray index in the commemoration of their original creator, Dr. Alexander Elder.
 
Using the two indicators, the Elder-Ray indicator tries to look behind the apparent prices and determine the actual strength of buyers’ (bulls) and sellers’ (bears) interests on the market. Both bulls and bears are trying to push the price in their favor, either up for selling or down for buying.
 
Apart from the bulls bears Power indicator combination, the Elder-Ray indicator also uses the Exponential Moving Average (EMA) to calculate the strength of two sides of the trade. Usually, a 13-day EMA is taken as a baseline, and depending on how the bears and bulls' powers act relative to it, traders may buy or sell their assets.
 
Basically, when the EMA is increasing while the bear power is negative but increases, the Elder-Ray indicator gives out the signal to buy an asset; conversely, when the EMA is decreasing while the bull power is positive but decreases, the Elder-Ray indicator gives out the signal to sell an asset. In the end, these forces interchange between one another and balance out the general price of the asset.
 

Start Trading in 10 Minutes

Apply everything you’ve learnt on a real trading account with up to 1:1000 leverage, negative balance protection and outstanding support.
Get Started

Bears and bulls power indicator explained

Every financial market from FX, stocks, commodities, indices, etc. is different from one another. But they all share lots of commonalities. The bull bear power indicator is useful for trading any market. The indicator is using the Exponential Moving Average, which means that this is a lagging indicator. In Forex, you will come across leading and lagging indicator types. Leading indicators signal upcoming trend reversals or new trend formations. Lagging indicators, such as the bulls bears indicator, improve visualization and the information becomes easily digestible for traders. 

The bear bull indicator shows whether buyers or sellers have the initiative. The indicator receives its values based on previous candle, for instance, if the current candle closes higher than the previous one, we'll get an increase in the bull's indicator and vice versa. The indicator is coupled with the Exponential Moving Average EMA. Keep in mind that the EMA works best in trending markets, but fails to produce reliable signals in choppy and ranging market conditions. 
 
Bulls are interested in buying an asset, and as any regular buyer, they want to get the product/service as cheaply as possible. Bears are interested in selling an asset, and they want to do that as extensively as possible. It's important to determine significant levels where you can enter the trade with the best price possible. When using the bull bear power indicator, patience and waiting for trading signals in a trending environment is critical. 
 
The indicator was created by a Russian-America professional trader, Dr. Alexander Elder, that's how the bulls bears indicator received its name – the Elder-Ray.
Bulls and bears power for beginners
The second name “Ray” hints to the indicator’s ability to see through the surface of the market prices, just like an X-ray does. Using it, traders can detect the potential strength of an uptrend/downtrend and make trading decisions accordingly.
 
The Elder-Ray indicator incorporates bulls and bears power oscillators to detect the trend – whether a price is in an uptrend or a downtrend. On top of that, this indicator also uses the Exponential Moving Average (EMA) indicator, which is also a trend-detecting tool. These individual elements together give out various signals to the traders.
 
Bulls power derives from the subtraction of an exponential moving average (usually, the time frame is 13 days) from a high price of an asset. Bear power derives from the subtraction of the EMA from a low price of an asset. Then, the two powers are put as histograms in the bar chart.
 
Then, a 13-day EMA is taken as a baseline that is going to measure the strength of the bulls and bears powers. By interpreting the individual movements of the 13-day EMA and bulls and bears power histograms, the Elder-Ray indicator gives out signals as to when to buy or sell an asset.
Now, let’s talk about how traders actually interpret the movements of Bulls and Bears signals. In a combination of a 13-day EMA, the Elder-Ray indicator gives out a signal to buy an asset when the following conditions are met:
 
  • The EMA is in an uptrend (increasing)
  • The Bears Power is negative but is increasing as well
 
These two trends show that: a) The average price has been increasing for the past 13 days, and b) The sellers’ (Bears) position is at its lowest point and is starting to increase. Therefore, it is the best time for a trader to buy an asset.
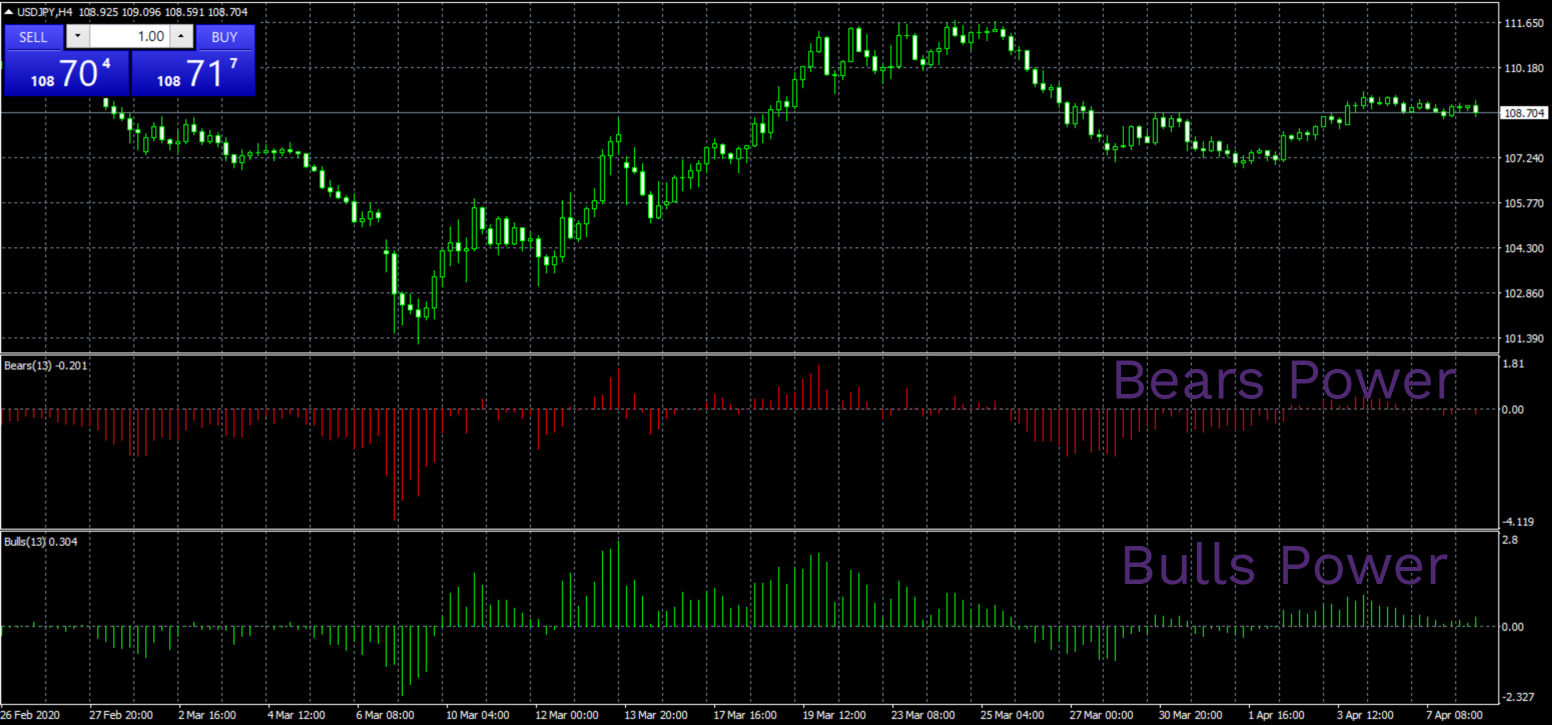
Bulls bears power indicator mt4

Conversely, the Elder-Ray indicator gives out a signal to sell an asset when the following conditions are met:
 
  • The EMA is in a downtrend (decreasing)
  • The Bulls Power is positive but is decreasing as well
 
What these two trends show is that: a) The average price of the asset has been going down for the past 13 days, and b) The buyers’ (Bulls) position is at its weakest point but is slowly gaining strength. Therefore, this is the best time to buy an asset.
 
These two main conditions are absolutely essential to the detection of a trend and for the Elder-Ray indicator to be precise in its signals.


The buyers and sellers strength indicator in MT4

When it comes to using the Bulls Bears power indicator, MT4 is one of the simplest pieces of software for it. They are available to the platform as a default, therefore, adding them to a chart is quite simple.
 
All traders have to do is click the “Insert” menu in the top-right corner, go to the “Indicators”, choose “Oscillators,” and then put both “Bull Power” and “Bear Power” in the chart. While these indicators can be put individually, it is much more effective to use them together, as was the original intention of Dr. Elder.
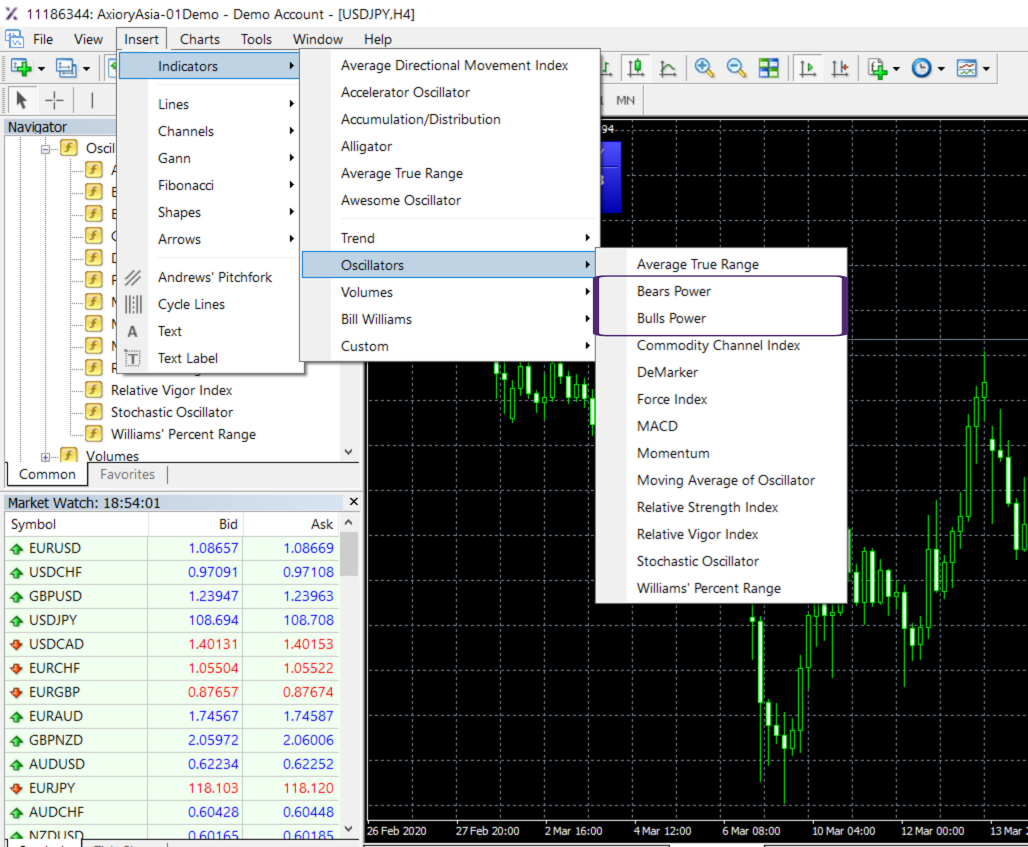
Bulls & bears indicator chart
And, alongside those two indicators, it’s also important to plot the 13-day Exponential Moving Average on the chart. This way, the Elder-Ray index will work at its best and the signals will be more accurate.
 

Start Trading in 10 Minutes

Apply everything you’ve learnt on a real trading account with up to 1:1000 leverage, negative balance protection and outstanding support.
Get Started

Bulls & Bears Power indicators – Key takeaways

Bulls and Bears Power indicators are used in trading to measure the strength of trends in trading. The Bulls power measures the strength of buyers’ position and Bears power measures the sellers’ position.
 
The two indicators were developed by Dr. Alexander Elder who, by combining a 13-day Exponential Moving Average to these indicators, created the Elder-Ray index. When a trader uses the Elder-Ray index to observe the prices, they get signals to either buy or sell an asset.
 
The signal to buy an asset occurs when the 13-day EMA (baseline) is increasing, while the Bulls power is negative but increasing. The signal to sell an asset occurs when the EMA is decreasing, while the Bears power is positive but decreasing. These individual indicators are available in MetaTrader 4 on default and can easily be applied to the chat.
 

FAQ on bulls and bears power indicators

What does bulls and bears power mean?

In trading, as well as any other market, there are two essential participants: buyers and sellers. Buyers create demand for a given product/service, whereas sellers supply those to the market.
 
In trading terms, buyers are called Bulls, and sellers are called Bears. Within the Bulls vs Bears indicator division, Bulls are always trying to buy assets at the lowest possible price, while Bears want the highest selling price for their assets.
 
The Bulls and Bears power for beginners, therefore, is quite simple to understand: these indicators are put on the chart in order to measure just how successfully buyers (Bulls) and sellers (Bears) are managing to buy/sell their assets at preferred prices.


Which software offers bulls and bears power indicators?

Bulls and Bears power oscillators are among the default indicators in many pieces of software, including MetaTrader 4/5, cTrader, etc. That’s because these indicators are very often used to receive signals as to when to buy or sell an asset.
 
In MT4, it is very easy to put these oscillators onto the chart. All a trader needs to do is go to the “Insert” menu in the top-right corner of the screen, go down to “Indicators”, choose “Oscillators”, and select “Bulls Power” and “Bears Power”. These are two different indicators, yet to use them most effectively, it is better to use them in a combination.
 
Plus, to complete the Elder-Ray set, traders can also put the Exponential Moving Average indicator to the chart. This way, there will be a 13-day baseline that will indicate whether the average price has been increasing or decreasing for the past 13 days, while the power oscillators will measure the strength of those trends.


How to interpret Bulls and Bears power indicator signals in trading?

As noted in the article, it is better to use Bulls and Bears power indicators with the Exponential Moving Average. Usually, the EMA is plotted for 13 days as a baseline.
 
So, as a rule of thumb, the Elder-Ray indicator gives out the buy signal when the following conditions are met:
 
  • The EMA is increasing
  • The Bears power is negative but increasing

 
Conversely, the sell signal occurs when the following conditions are met:
 
  • The EMA is decreasing
  • The Bulls power is positive, but decreasing
 
These are the two most essential conditions for each signal; when they occur, the Elder-Ray index gives out the signal to make a corresponding decision.

What is bull bear power indicator?

Bull bear power indicator is a technical tool that helps traders measure the strengths of bull and bear trends. The indicator is lagging type, which means that it doesn't predict where prices might go next. The indicator makes visualization better.

How to use bull bear power indicator?

In order to profitably trade using the indicator, it's important to apply it in trending markets. The signal to buy an asset occurs when the 13-day EMA (baseline) is increasing, while the Bulls power is negative but increasing. The indicator produces a sell signal when the EMA is decreasing, while the Bears power is positive but decreasing. Keep in mind that technical indicators fail to incorporate fundamentals such as economic announcements and political news in their analysis. For this very reason, it's critical to always keep an eye on the economic calendar. In addition, it's always recommended to use a stop loss order when placing an order. 
Axiory uses cookies to improve your browsing experience. You can click Accept or continue browsing to consent to cookies usage. Please read our Cookie Policy to learn more.