How do Momentum Indicator Stocks Work?
Investors can apply the concept of the Momentum indicator in an attempt to profit from rising stock prices and reduce losses from falling stock prices. To accomplish this, investors can use the momentum indicator to measure a stock's momentum up or down. The momentum is an indicator that evaluates the rate of movement in the specific stock's price. This might sound complex, but it is really quite simple to comprehend.
When it comes to stock price, the momentum of a stock's trend slows before it changes its direction. Investors can calculate
momentum indicator stocks by measuring price differences over a specific time period. For example, a 10-day momentum indicator is calculated by subtracting the closing price of 10 days ago from the closing price at the given moment. The indicator then plots this value as a line on the stock chart. So, if today's price is the same as it was 10 days ago, the indicator plots at the zero line. But if today's price is higher, the indicator plots above the zero line. When the indicator crosses the zero line, some investors might consider this a possible entry or exit signal.
Let’s take a real-life example. Let’s suppose a trader enters a position when the momentum indicator crosses above zero. He would then possibly hold the position as long as the indicator stays above zero. When the indicator crosses below the zero lines, the investor might take that as an exit signal. While this example trade may have been profitable, not all crossover points are reliable entry or exit signals. This is because the momentum indicator can generate numerous signals as it crosses above and below the zero lines.
3 of The Best Stock Momentum Indicators
The
momentum indicator in the stock market is also known as the momentum oscillator indicator. It is one of those indicators that are available to stock traders to help gauge the momentum in the market. Several of the best stock momentum indicators in the stock market include MACD, RSI, and ADX. The MACD indicator is the moving average Convergence divergence negator. RSI is the relative strength index that works in the market as an indicator. In this article, we will further talk about the top three best stop momentum indicators. On top of that, we will provide an example to clarify how they really work in real-life trading.
MACD
Originating in the 1970s, MACD is a popular technical
stock chart momentum indicator used for identifying momentum in the market. It stands for Moving Average Convergence Divergence and shows the relationship between two moving averages of a securities price, but what is a moving average? This is a line representing the average value of prior data over a given period which will commonly be used to ascertain momentum or grade trends. Some traders will use multiple moving averages to try and gain better information between short and long-term trends.
One of the more common setups, pairs the 50 and 200-day moving averages when the 50 crosses above the 200 which traders sometimes refer to as a Golden Cross. This could be interpreted as a bullish sign. When the 50 crosses below the 200 that is sometimes called the Death Cross and could be seen as bearish. A possible pitfall of using moving average crossovers as a trading signal is that they are inherently lagging. Another is that they generate a plethora of false signals and range-bound markets. This means traders need better context and strategy to gauge market momentum and this is where the MACD
momentum indicator in the stock market can come into play.
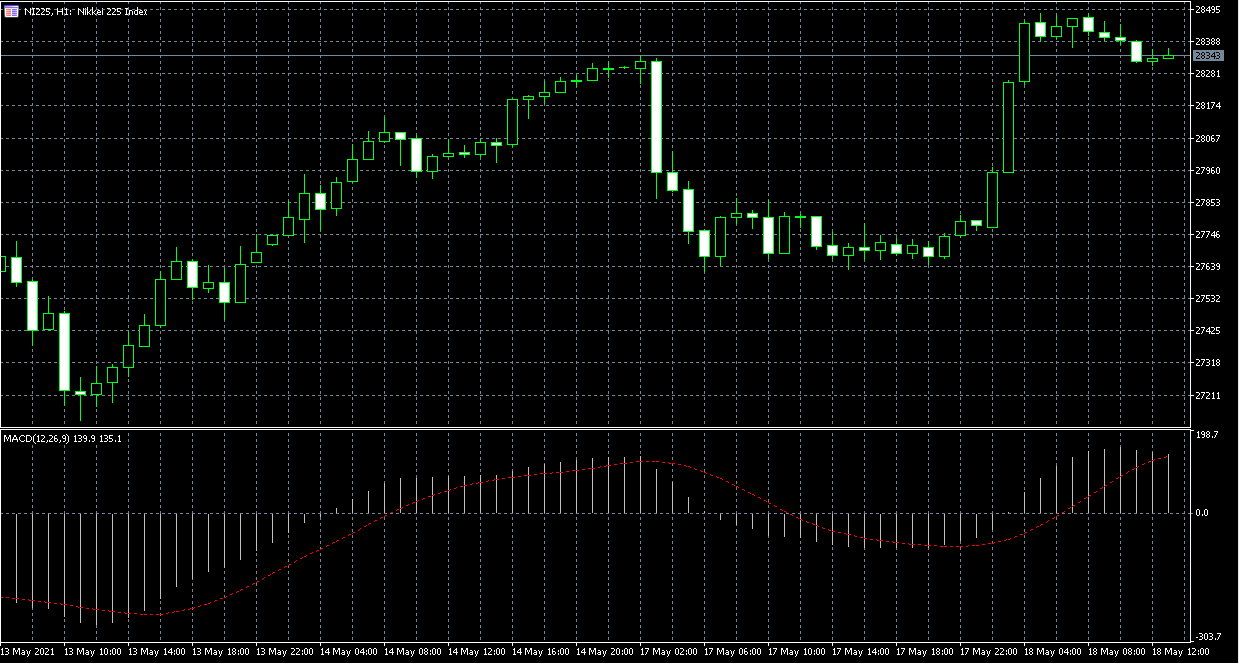
Example of MACD
The default inputs for MACD are often 12, 26, and 9 which we will discuss for this example. The first two inputs are the moving averages that feed into the value of the MACD line. The MACD line itself will grade the deviation between the 12 and 26-period exponential moving averages or EMA's. Notice how when the 12 period EMA crosses over the 26-period EMA. The MACD line crosses over the zero lines in the indicator.
RSI
While we have
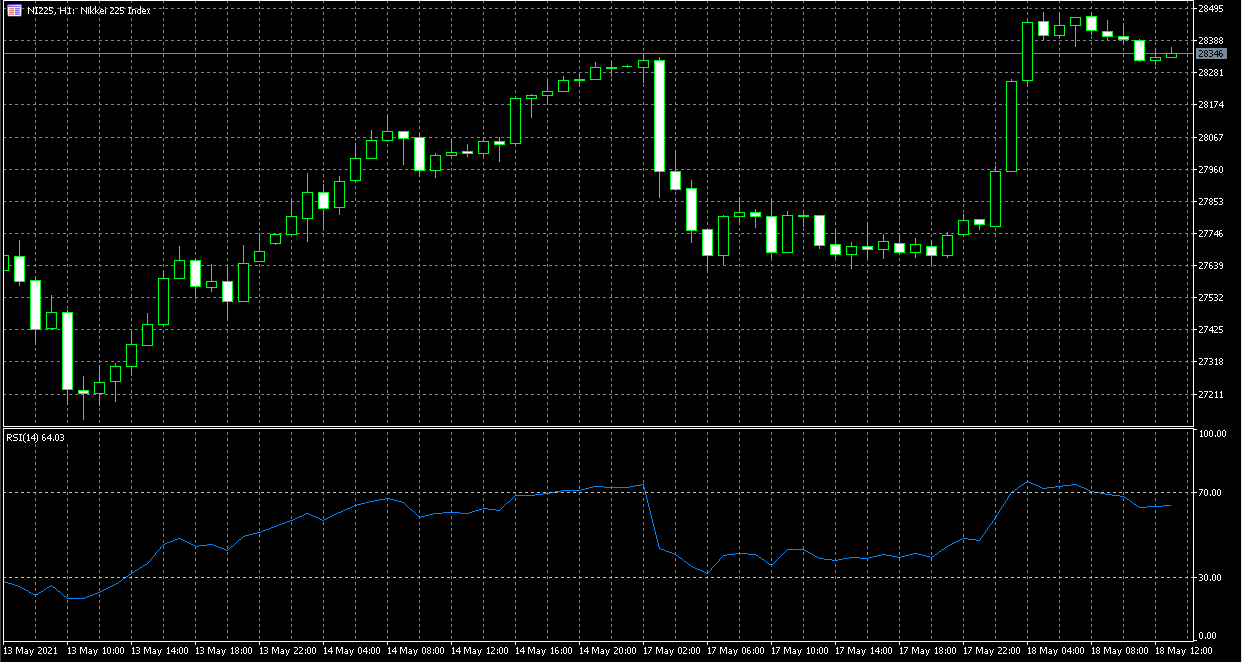
stock momentum indicators explained, it is important to note that The Relative Strength Index, or RSI, is an oscillating indicator that is designed to measure a stock's momentum, which is both the speed and size of price changes. Generally, a lot of investors use the RSI index in order to assess if a specific stock is overbought or oversold. This is the major way how the traders find out if there is an appropriate time for entry and exit trading.
In order to calculate the RSI index, the first thing the trader should do is to identify a previous time period to use. A time is usually 14 days on average, however, it sometimes can be shorter and sometimes even longer. The next step is, to sum the average gains up and divide them by the average losses during the period of time you've chosen. The result, or value, of the calculation is referred to as relative strength.
The relative strength value is then represented on a graph ranging from zero to one hundred. Plotting a line helps investors measure momentum in relative terms, which means looking at the indicator's current value in relation to past values.
To spot probable trend shifts, it is important to note that there are two
momentum indicator stocks, ranges including overbought and oversold. Overbought refers to a stock that has increased rapidly in a short period of time and may reverse lower.
Conversely, oversold refers to a stock that has decreased sharply in a short period of time and may reverse higher. Whenever the RSI value reaches above 30, most traders take that as an “oversold” indicator and start preparing for a bullish rebound. Exit signals work the same way, except investors use overbought values.
The same applies to the “overbought” signal. Whenever the RSI is above 70 or so, traders believe there will soon be a bearish correction, hurdling the stock down to where it started.
ADX
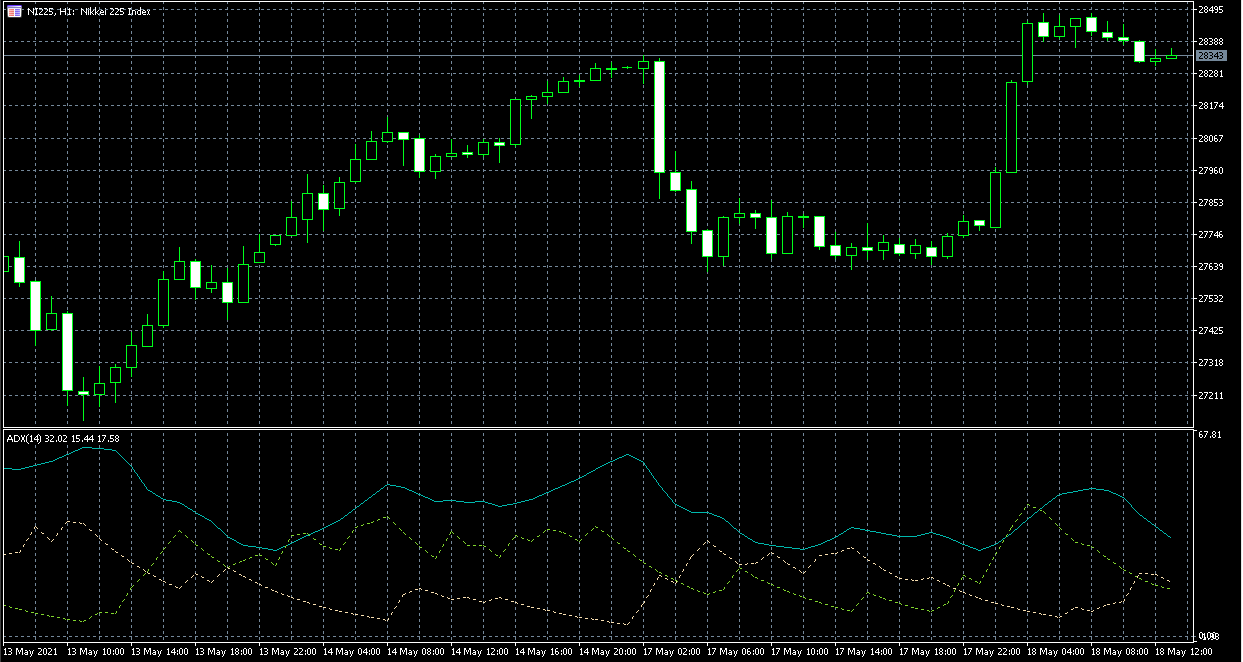
When discussing ADX indicators, it should be noted that most trading platforms offer two distinct versions of the ADX indicator, which causes many individuals to become confused when adding it to their charts. The earliest version of this indicator contains only one line, it is the ADX line. The ADX line, the positive directional indicator (+DI), and the negative directional indicator (NDI) are all present in the second type of this indicator (-DI).
ADX is an abbreviation for the average directional movement index. This indicator detects whether or not there is a trend in the stock market by measuring the strength of the trend. It is vital to understand that ADX is a non-directional indicator, which means that when there is a strong upward trend on the charts and the price is increasing, then the ADX line will also rise. On the other hand, when there is a strong downward trend on the charts and the price is falling, the ADX line will actually be rising. This fact proves that the ADX is truly a non-directional
stock price momentum indicator.
Example of ADX
There are several charts that precisely show an example of the ADX uptrend turning to a downtrend. Traders should always take close attention to how ADX grows throughout the rise when +DMI is higher than -DMI. When the price is reversed, the -DMI can be above the +DMI, and the ADX might rise to assess the strength of the downtrend. This is a particular example and is not referred to in every case.
Besides, it should also be noted that when any indicator is applied, it should contain information that price alone cannot provide. The greatest trends, for example, emerge from periods of price range consolidation.