Top 3 Stock Volatility Trackers Listed
There are several indicators to measure volatility in the stock market. So, in order to choose the best ones among hundreds, it’s important to focus on multiple factors, including whether an indicator is free or not.
According to these metrics this and many other factors, one of the best volatility trackers to measure the stock market’s volatility is boiled down to CVI, Bollinger Bands, and ATR. Let’s discuss them one by one and learn what their main features are and how they are used in the marketplace by stock traders.
CVI (Cboe Volatility Index)
The stock market volatility indicator - cumulative volume index, or CVI, is a volume metric that measures the flow of capital into or out of the stock market by calculating the gap between advancing and falling stocks and applying it to an accumulated amount.
The total volume index (CVI) determines how capital is flowing into or out of an index.
It is a trend tracker that takes into account market advancements and decreases.
The CVI would apply the advancing stocks less the decreasing stocks to the CVI value from the time previously.
In case if you want to calculate CVI, you can use the following formula:
CVI = PPCVI + (Advancing Stocks - Declining Stocks).
In this formula, PPCVI is the prior period’s CVI, while advancing stocks are showing these shares that are going up and declining stocks are those stocks that are changing their prices negatively.
The stock price volatility indicator - cumulative volume indicator is a momentum metric that indicates the movement of a stock or index, such as NASDAQ and S&P 500. Although its title implies that it is similar to the On-Balance-Volume tracker, the contrast is that CVI only considers the number of shares rather than their value.
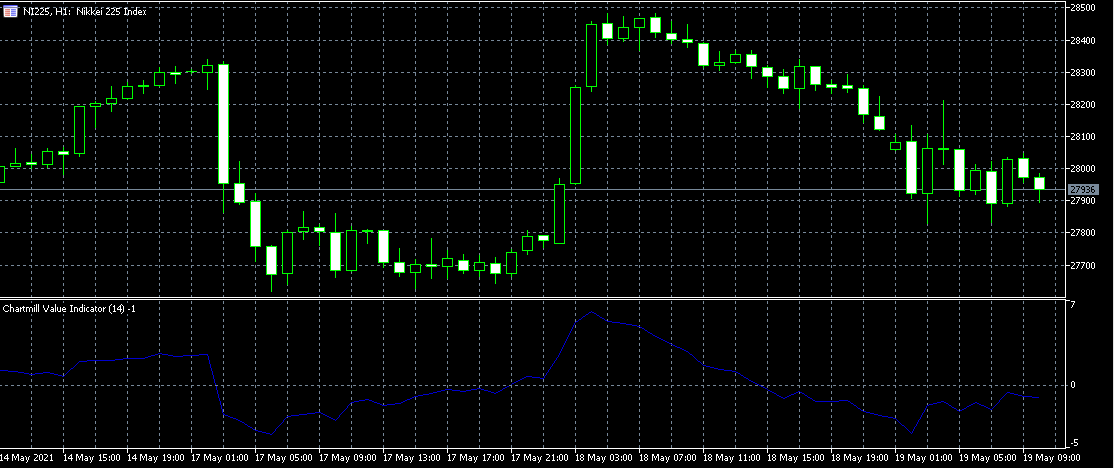
It's crucial to remember while reading the CVI that the exact amount does not really have meaning since it's not standardized. Traders and investors should rather view the CVI's pattern throughout time similarly to the index's valuation.
CVI is still used by many traders and analysts in combination with other types of technical analysis, such as chart trends or technical indicators, rather than as a single predictor. By searching for evidence of patterns and reversals, they may maximize the chances of a fruitful trade.
This volatility indicator for stocks defines whether capital is flowing into or out of the index. If the CVI is falling lower, investors may believe that a trend is losing traction and that a turnaround is unavoidable. If the CVI is trending higher, traders will believe that a trend is gaining traction and that it is time to trade along with the trend.
Simultaneously, traders can seek divergences or convergences between the price and CVI trend lines. Price ups and downs that are not represented in the CVI readings may indicate a weakening trend and an expected correction.
Bollinger Bands
John Bollinger created Bollinger Bands, which is used for stock volatility measures. Top and bottom price range rates are described by pricing envelopes. Bollinger Bands are value sheets measured at a standard deviation range above and below the bond's simple moving average. The bands respond to uncertainty fluctuations in the market asset since their gap is dependent on standard deviation.
Bollinger Bands are defined by two variables: period and standard deviation (StdDev). The default values for time and standard deviation are 20 or 2, respectively, but you may change them.
When the bands tighten during a time of low fluctuations, the probability of a sudden price change in any direction increases. This may be the start of a pattern and the way to measure stock volatility. Keep an eye out for a superficial step throughout the opposite direction that reverses before the true pattern begins.
When the bands deviate by an unusually huge amount, volatility rises and any current trend can come to an end.
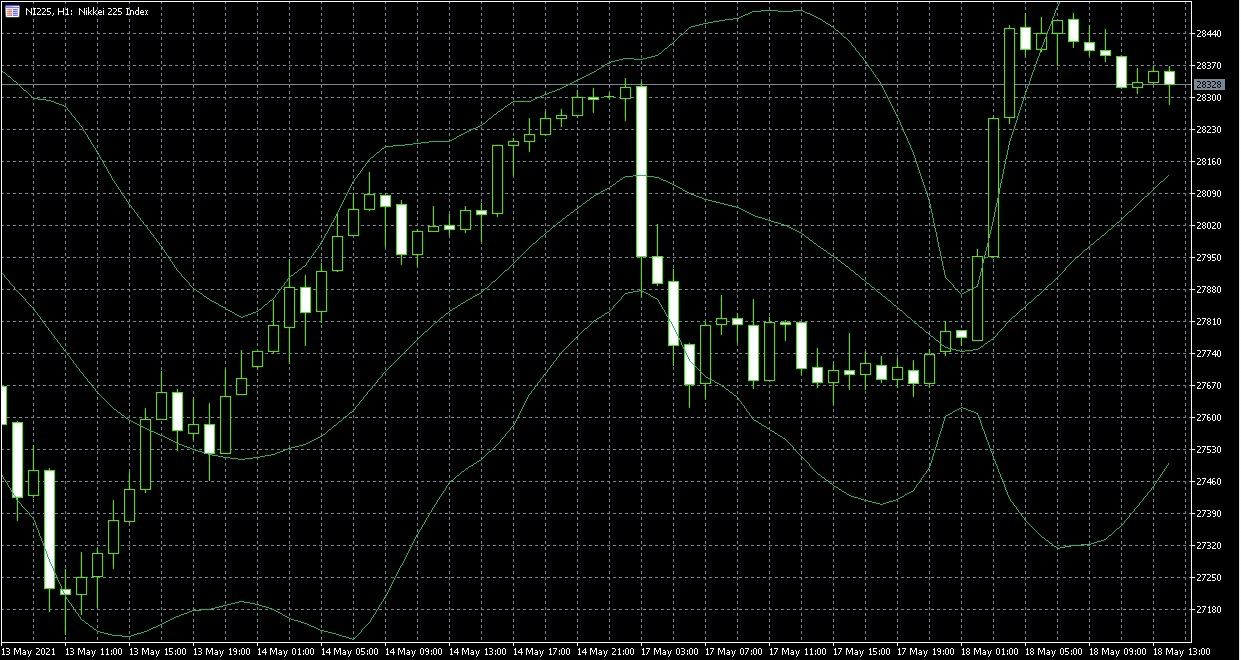
Prices have a propensity to bounce inside the envelopes of the bands, hitting each band and switching to the other. These changes can also be used to determine future benefit goals. If a price jumps by a little rate and then crosses over the moving average, the band which was upper is a new benefit goal.
Through intense movements, the price can surpass or embrace a band envelope for extended periods of time. When a momentum oscillator moves away, you may need to do more testing to see if getting extra gains is a good idea for you. Whenever the price breaks out of the bands, a solid trend continuity is likely. However, if rates suddenly return to within the band, the suggested intensity is invalid.
If you want to calculate market volatility through this volatility indicator stock, at first, you need to calculate SMA, which is called, as well, a simple moving average. After that, you need to calculate the standard deviation during the time which was used for calculating SMA. In the case of the upper band, you need to sum SMA and the rate of standard deviation. For the lower band, you need to see the difference between the SMA and standard deviation.
Also, you can calculate the volatility regarding short, medium, and long terms. If you want to calculate the market’s fluctuation rate, then you need to use SMA for 10 days and bands with a 1.5 standard deviation. In terms of the medium term, you need to calculate the 20-day moving average and set the standard deviation at 2. While calculating the long-term volatility index, you need to calculate the first 50-day moving average and set the standard deviation at 2.5.
ATR (Average True Range)
The average true range (ATR) is a stock volatility tracker. It is a technical analysis metric invented by market technician J. Welles Wilder Jr. The real range measure is the best of the following: the present highest minus the actual lowest; the absolute value of the present highest minus the last close; and the absolute value of the present low minus the last close. The ATR is then calculated as a 14-day moving average of the true levels.
The average true range (ATR) is a technological metric that measures market price movements.
It is usually calculated by taking the 14-day simple moving average of a sequence of true range indicators. The ATR was designed for use in commodity markets but has since been extended to all categories of securities.
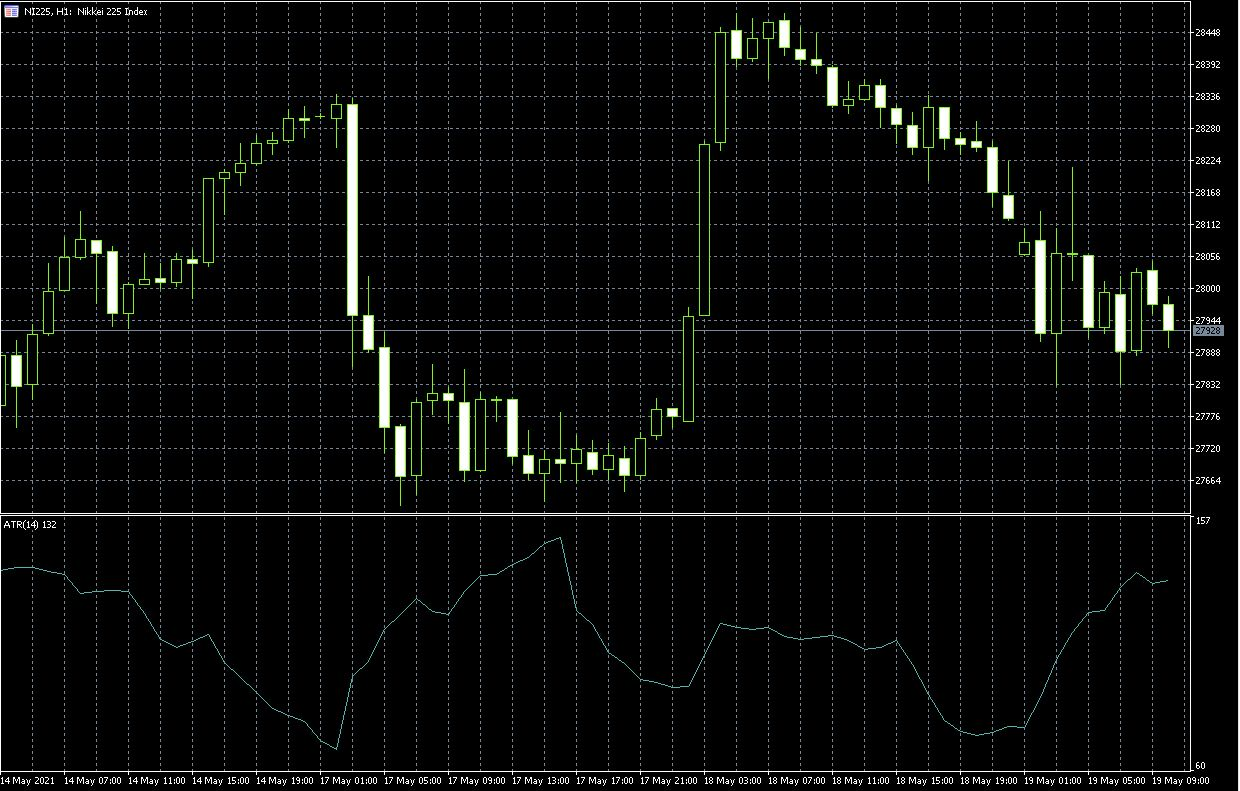
In order to calculate the stock volatility index - ATR, stock traders mostly divide each day and calculate their own TR which has 3 distinct formulas. These are:
H - L = TR
|H - Cp| = TR
|L - Cp| = TR
H here stands for the highest price stock was trading at during that particular day. L is the lowest price. And Cp is the price at which the stock was when trading stopped. Once all of this is calculated, the actual True Range of this stock during that particular day is the highest number from the equations we did. So if H - L has the highest value, then it is chosen as the True Range.
Once every day’s TR is calculated, stock traders then move to ATR to determine the true value of a stock during a specific week. The formula for this is:
SUM(TR)/N
“N” Stands for the number of days we are trying to calculate the average for. If we are calculating for the whole week, then N would equal 5. But if we are calculating for 3 days, then N would equal 3.
Traders may use shorter time periods than 14 days to trigger more trading signals, whereas extended time periods are more likely to create fewer trading signals.
Assume a short-term investor just wants to look at a stock's volatility over the course of five trading days. As a result, the trader could compute the five-day ATR. The trader considers the limit of the total value of the actual high minus the present low, the total value of the present high minus the last close, and the total value of the existing low minus the last close, assuming the actual market data is ordered in chronological order.
The ATR was created by Wilder for assets, but it can also be used for shares and indexes. Merely stated, a stock with a high level of volatility has a higher ATR, whereas a stock with a weak level of movements has a lower ATR. Market professionals may be using the ATR to join and leave markets, and it is a handy instrument to use in trading.
It was designed to enable traders to more accurately calculate an investment's regular fluctuations using simple formulas. The metric does not signify market direction, rather, it is used to quantify uncertainty created by differences and to minimize up or down movements. The ATR is a reasonably easy calculation that requires only historical price data.
The ATR is a common exit approach that can be used regardless of how the entry decision has been made. The "chandelier exit" is a traditional technique. The chandelier exit puts a limit order below the stock's highest peak since you joined the exchange. The interval between the maximum higher and the stop level is expressed as a variable of the ATR.
There are two major drawbacks of using the ATR measure. The first is that ATR is a statistical metric, which means it can be interpreted in a variety of ways. There is no single ATR value that will tell you whether or not a pattern is going to reverse. Alternatively, ATR readings can often be compared to earlier findings to determine the power or lack of a pattern.
Second, ATR only tests uncertainty, not the market trajectory of an asset. This can also result in confusing signals, particularly when markets are changing direction or patterns are at a crossing point. For example, a sudden rise in the ATR after a major change towards the current trend may cause some traders to believe that the ATR is reflecting the old trend, but that might not be the case.