This article serves as a quick, practical guide on how to trade the main markets following the continuing conflict in the Middle East.
Oil
On Monday, we noted the big open gap following the Monday close. While general trading advice teaches us to fade the gap, we noted that due to the nature of the gap (complete repricing of the asset due to changing fundamentals), this one was comparatively less likely to fill.
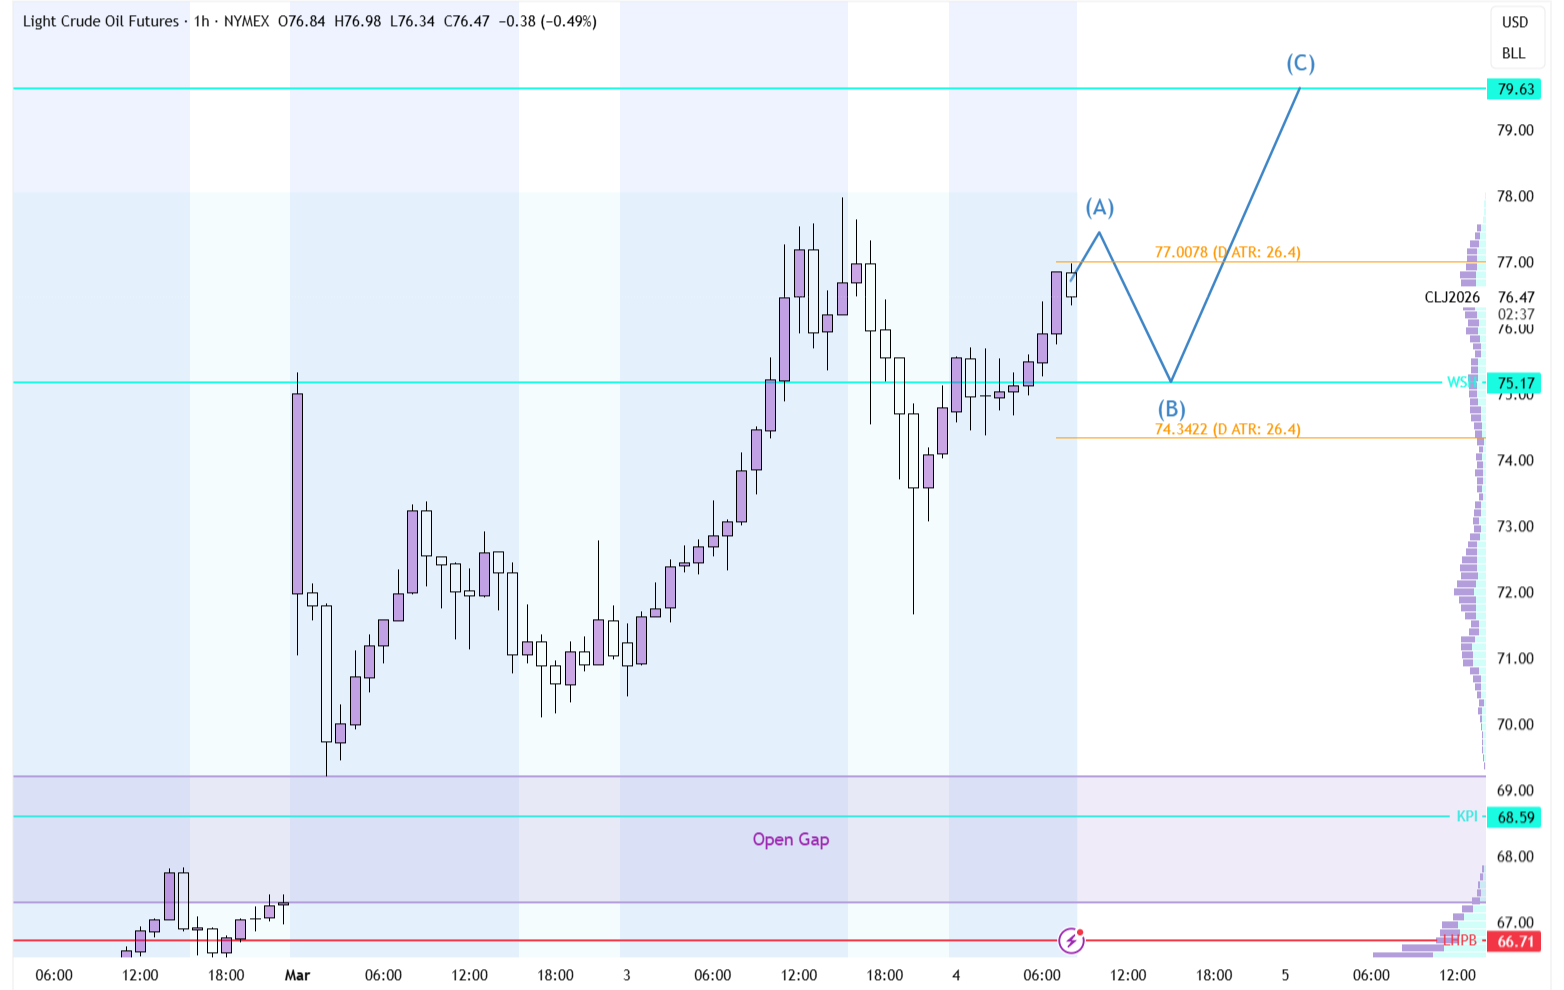
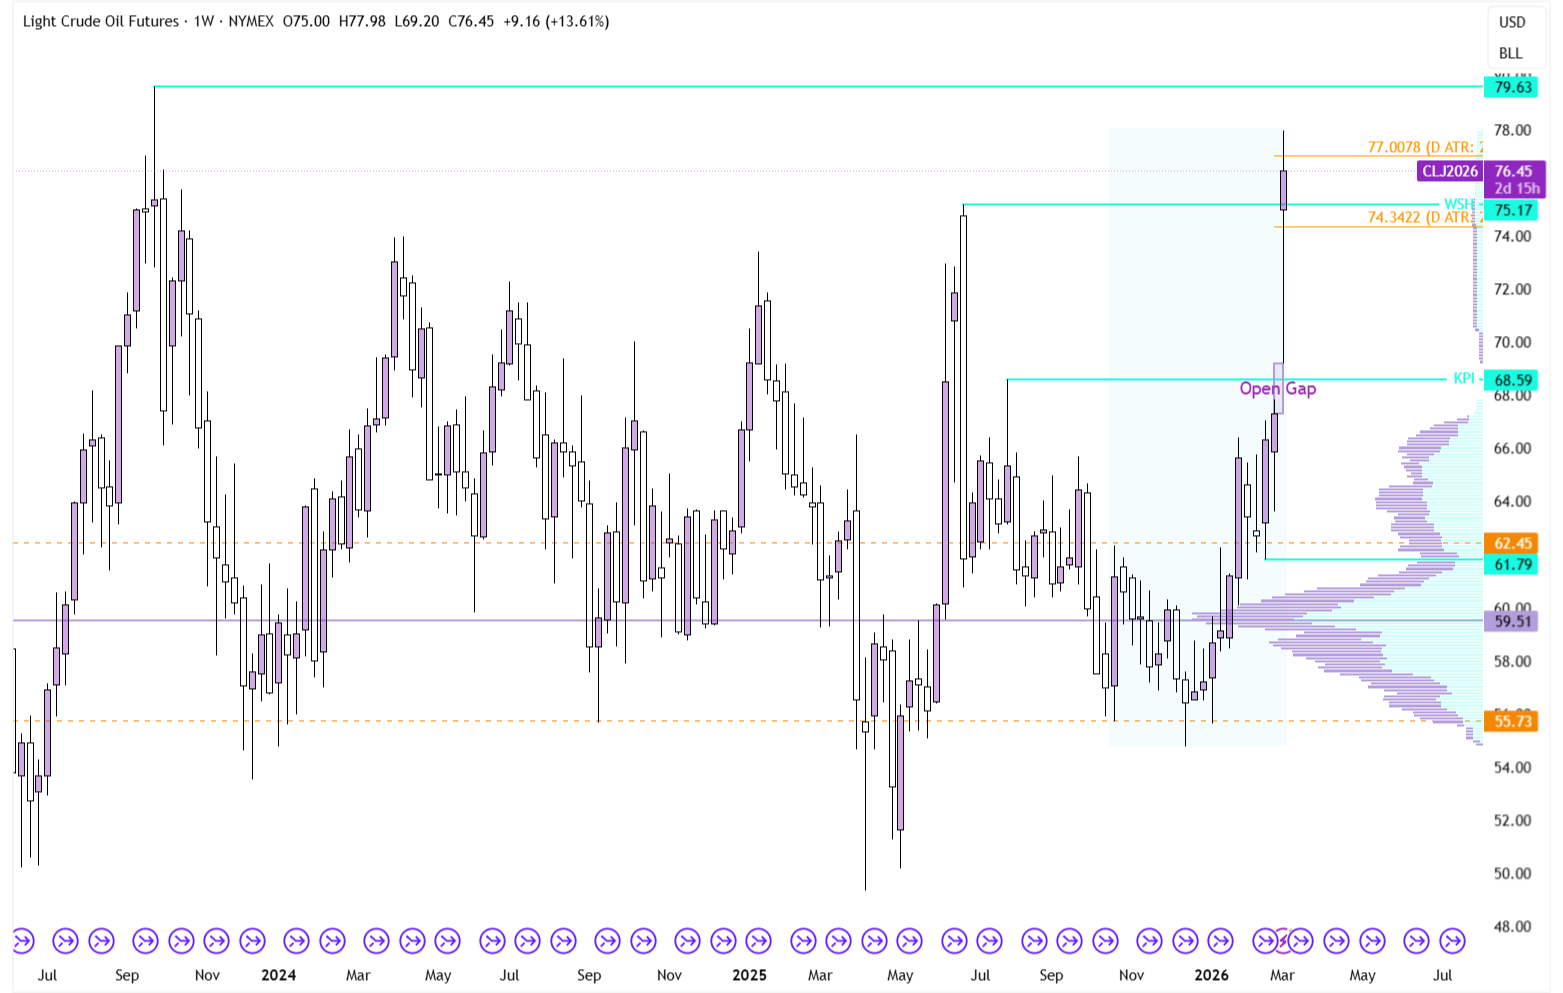
Crude Oil on the Daily Timeframe
Jumping forward to today, that gap is still unfilled. Furthermore, price has continued its way up and flipped the prior Weekly Swing High at $75.17 into support. From a technical perspective, price seems ready for a short retest of $75 from above before making its next move higher. That move would likely bring us to $79.63, which was the 2023 high.
Crude Oil on the Daily Timeframe
Gold
In Gold, price action has been rather tricky. After the weekend price gapped up as geopolitical uncertainty is seen as a bullish factor for Gold. However, this gap was filled the same day, leaving a rather neutral-looking chart by the end of the day on Monday.
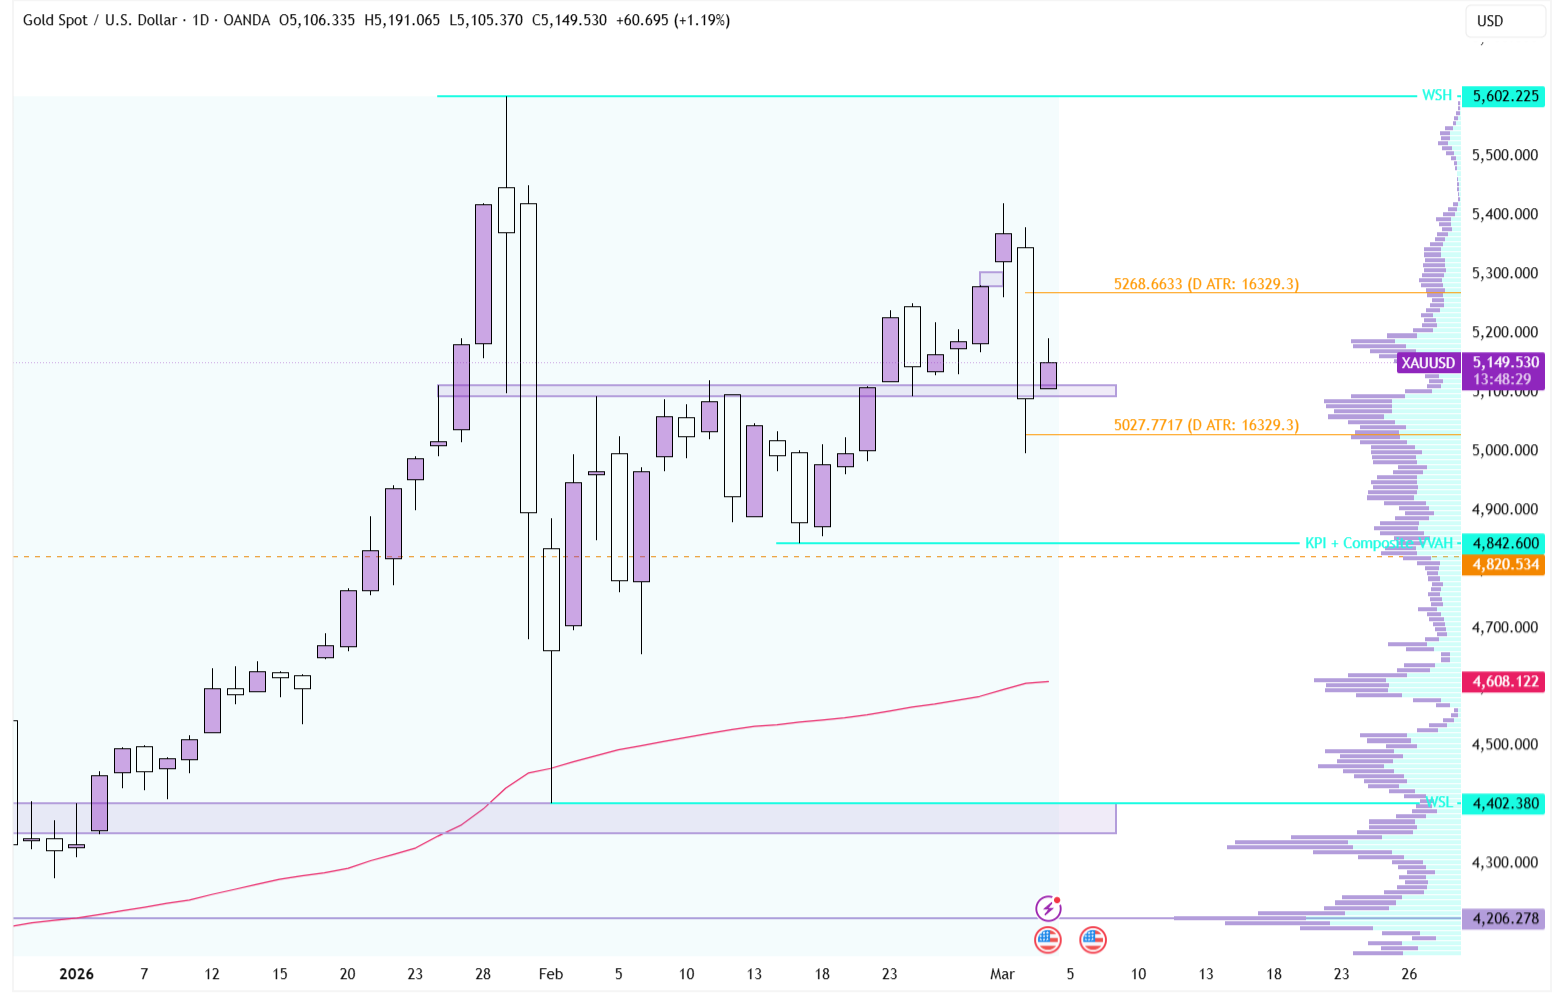
XAU/USD on the Daily Timeframe
Since then, in countertrend to what you would expect based purely on fundamental analysis, Gold has had a significant down day. As of writing this article on Wednesday noon DST, the price has found support at a key support area, drawn by connecting old highs and lows to the left of the chart.
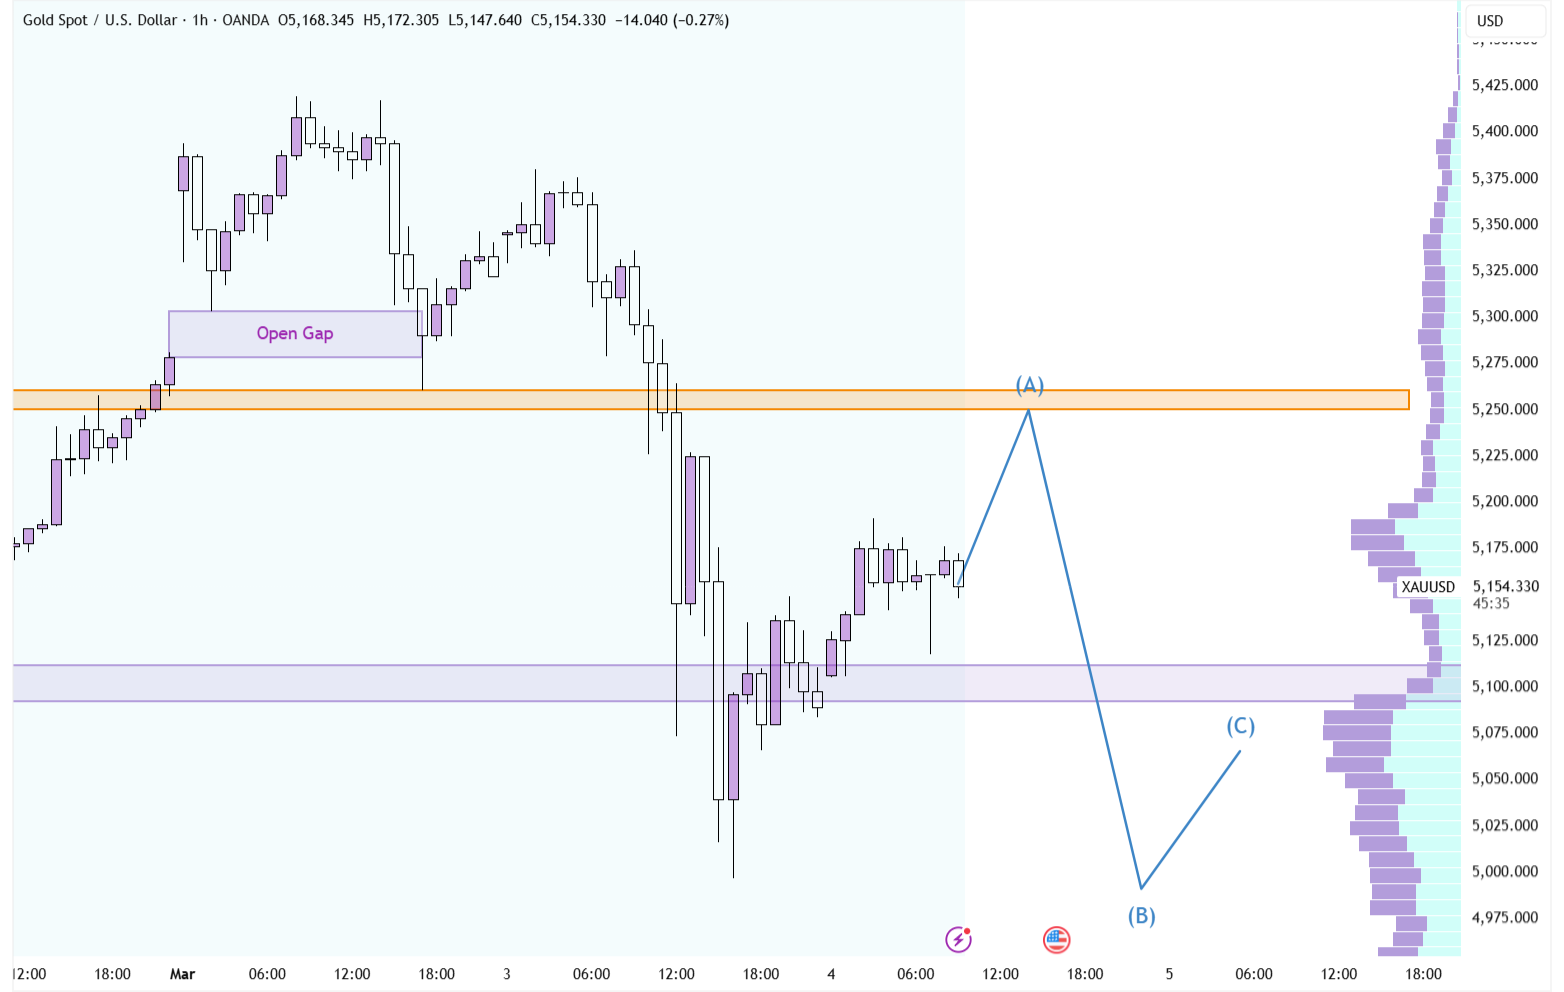
XAU/USD on the 1-hour Timeframe
Despite the fundamental bullish news, the technical picture looks somewhat bearish. Price is back again at a support zone that’s been tested before and is now creating a Weekly Lower High, essentially confirming a longer-term downtrend.
Furthermore, how assets react to major news often tells a lot about underlying strength. If Gold is unable to make a 6% move up to new ATHs on the backdrop of a major geopolitical conflict, then it seems like buyers are simply exhausted.
If that bearish bias does hold up, $5,250 is a prime level for price to fail and move sharply lower, although that level might not get a retest in the first place.
Haven't registered with Axiory yet? Create your account in minutes.
S&P 500
The initial development in the S&P 500 was to some degree the inverse of what happened in Gold. After a short move down, the price filled its open Gap at Monday’s New York Open and since then has gone down.
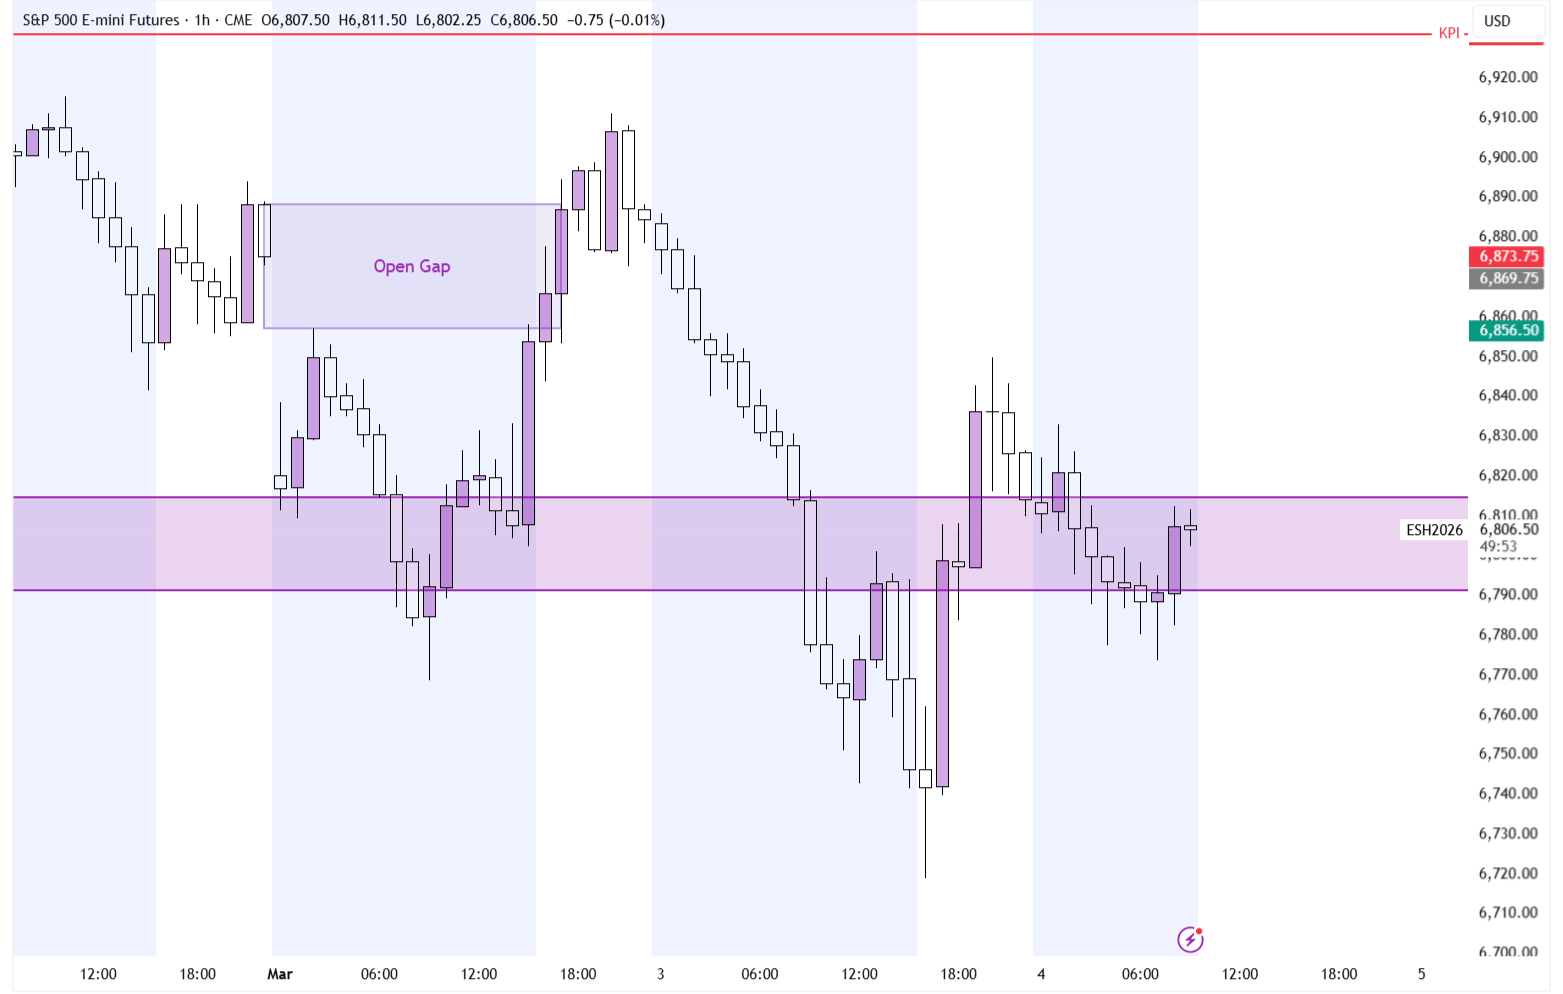
S&P 500 on the 1-Hour Timeframe
However, the current picture doesn’t quite suggest further downward movement as Gold does. On Tuesday, price swept two prior swing lows and closed at the upper end of the key $6,790-6,815 support area.
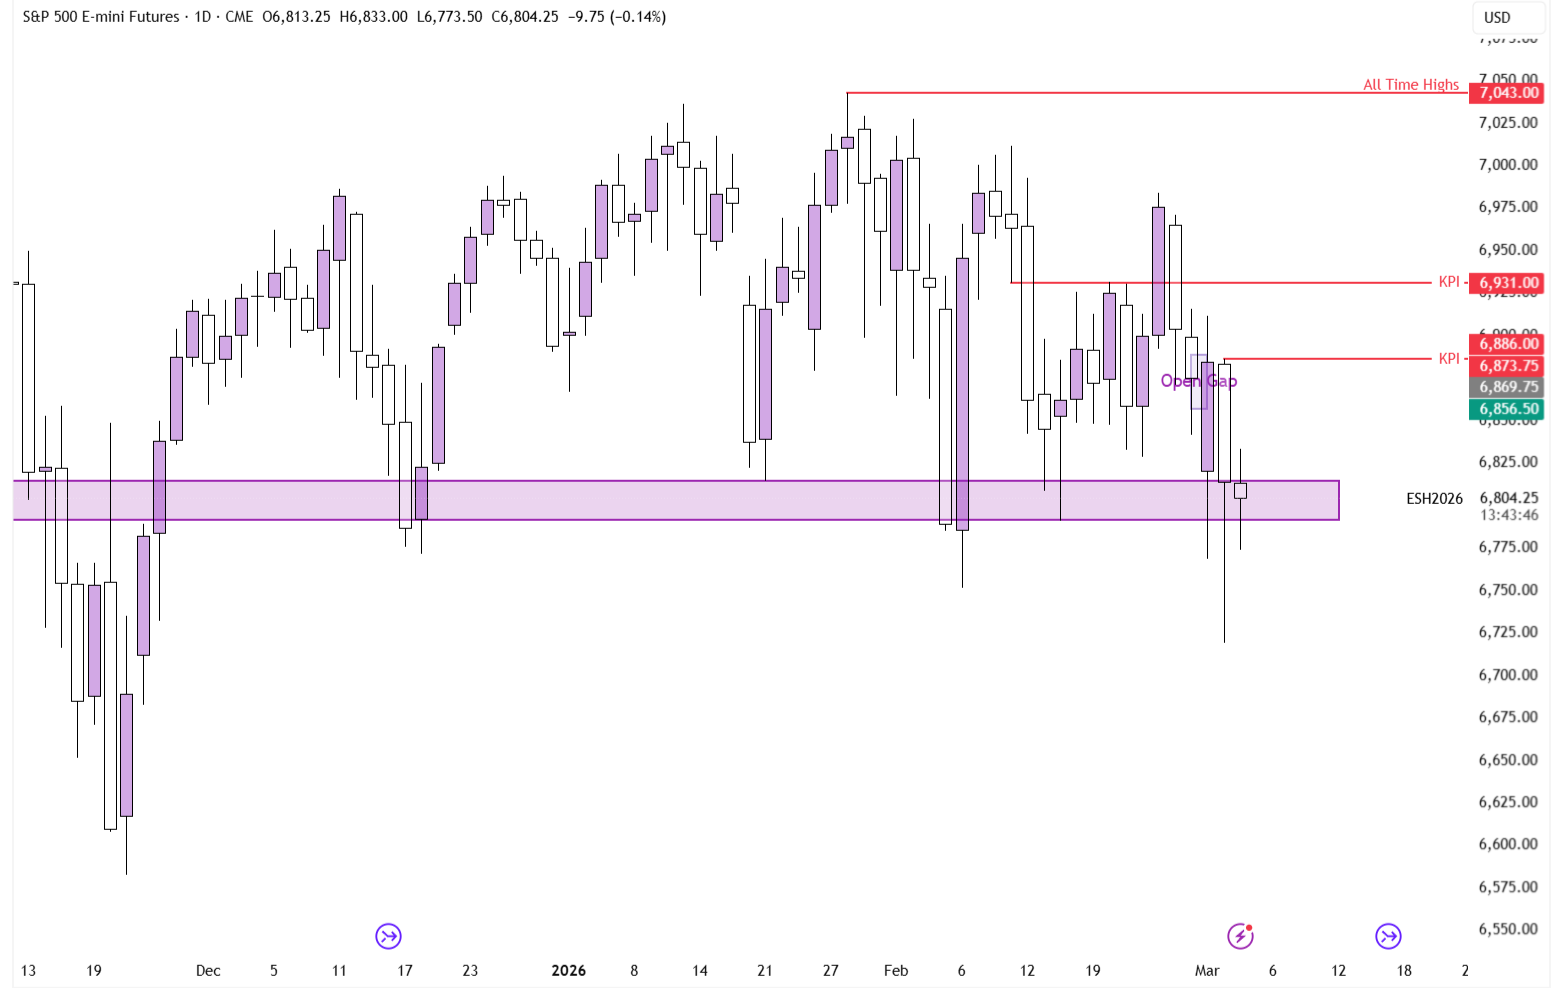
S&P 500 on the Daily Timeframe
The Daily timeframe is showing quite conflicting information. On the one hand, bearish geopolitical developments were unable to push prices down, even in the short-term, as price sweeps key major lows and closes back above support.
However, the current follow-through is very meager; after an SFP, you are traditionally expecting an immediate move to the opposite side, something which is currently not happening. Added to the fact that this has been the sixth distinct test of this support area from the upside, the level is now much weaker.
In a situation of conflicting data, it’s often best to take an ‘if, then’ approach. For example, if price moves back above Tuesday’s high at $6,886, the bias flips bullish; until then, a breakdown is somewhat likely.
USD/CAD
On Monday, we noted that USD/CAD was the most difficult asset to analyze, due to both sides of the pair being repriced. On the one hand, the USD was getting bid on safe-haven flows, while on the other, the Canadian Dollar was moving up in correlation with Oil, as the two are heavily correlated due to Canada’s significant Oil exports.
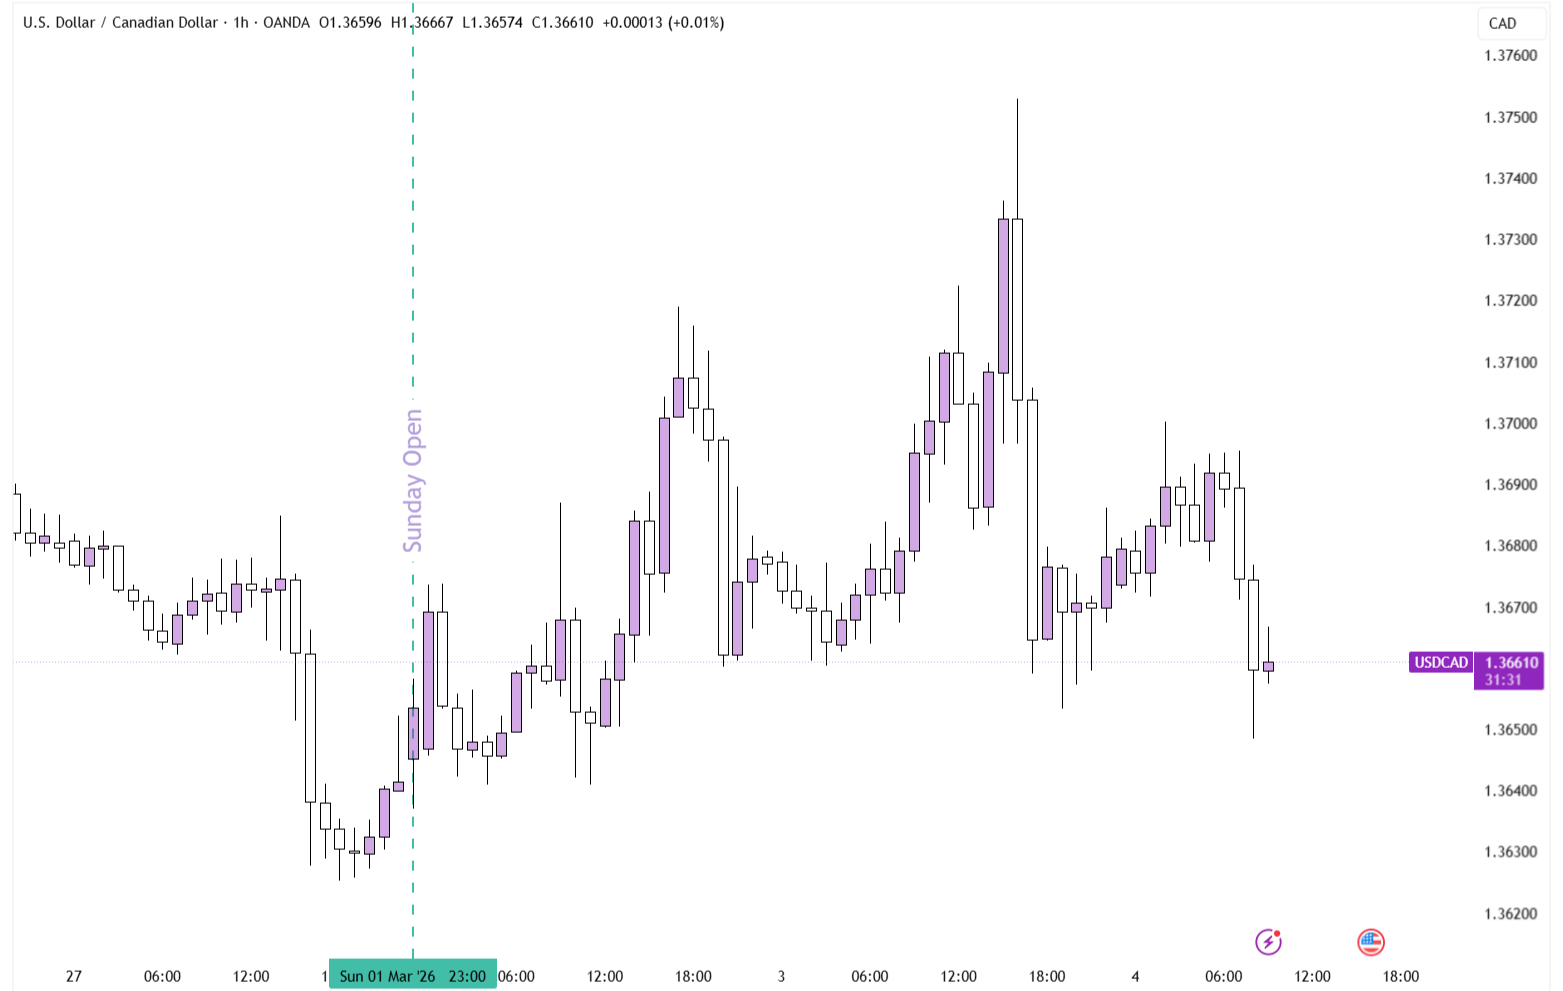
USD/CAD on the 1-hour Timeframe
That difficulty in predicting where the price will go hasn’t changed. So far, the risk-off narrative has comparatively pushed the U.S. Dollar higher than the CAD, but that may soon change. Barring any major escalations, Gold is showing that the safe-haven flows are already calming down.
Oil, on the other hand, seems like it has further to run, which in terms of this pair would mean that the Canadian Dollar is likely to continue its push up, while appreciation in the U.S. Dollar stalls. If true, that would essentially push USD/CAD lower.
Haven't registered with Axiory yet? Create your account in minutes.