USDJPY Consolidates After US Data
15 July 2022
The greenback traded slightly lower Friday as investors decided to take profits from the recent rally as the weekend looms.
As of writing, the USDJPY pair was down 0.20% but still very close to its cycle lows at 139.
Mixed US data
Despite sinking consumer confidence, and real wages dropping, analysts anticipated a rebound in retail sales in June following the surprise decline in May caused by a decline in vehicle sales; the headline retail sales indeed increased 1.0% monthly (in advance of the 0.9% predicted) – the best month since March.
The retail sales print for the "Control Group," which feeds the GDP, increased by 0.8% month on month (nearly triple the 0.3 percent anticipated).
As Alex Pelle, US economist at Mizuho Financial Group Inc., said in a note, "the report implies a very negative inflation-adjusted number on goods consumption, and the real-time GDP nowcasts are likely to be marked down significantly."
On the other hand, analysts had anticipated US Industrial Production to squeeze a 0.1% rise in June despite ISM surveys sinking. Still, they were mistaken as the industrial output fell 0.2% MoM. (and May was revised lower also). Since September 2021, there hasn't been a weaker month.
Just one day after another hot inflation report sparked speculation among strategists that the Federal Reserve may go as far as to raise rates by an entire percentage point later this month, JPMorgan CEO Jamie Dimon issued a warning that risks to the US economy appear "nearer than they were before" and said, "never-before-seen quantitative tightening" is expected to have negative consequences.
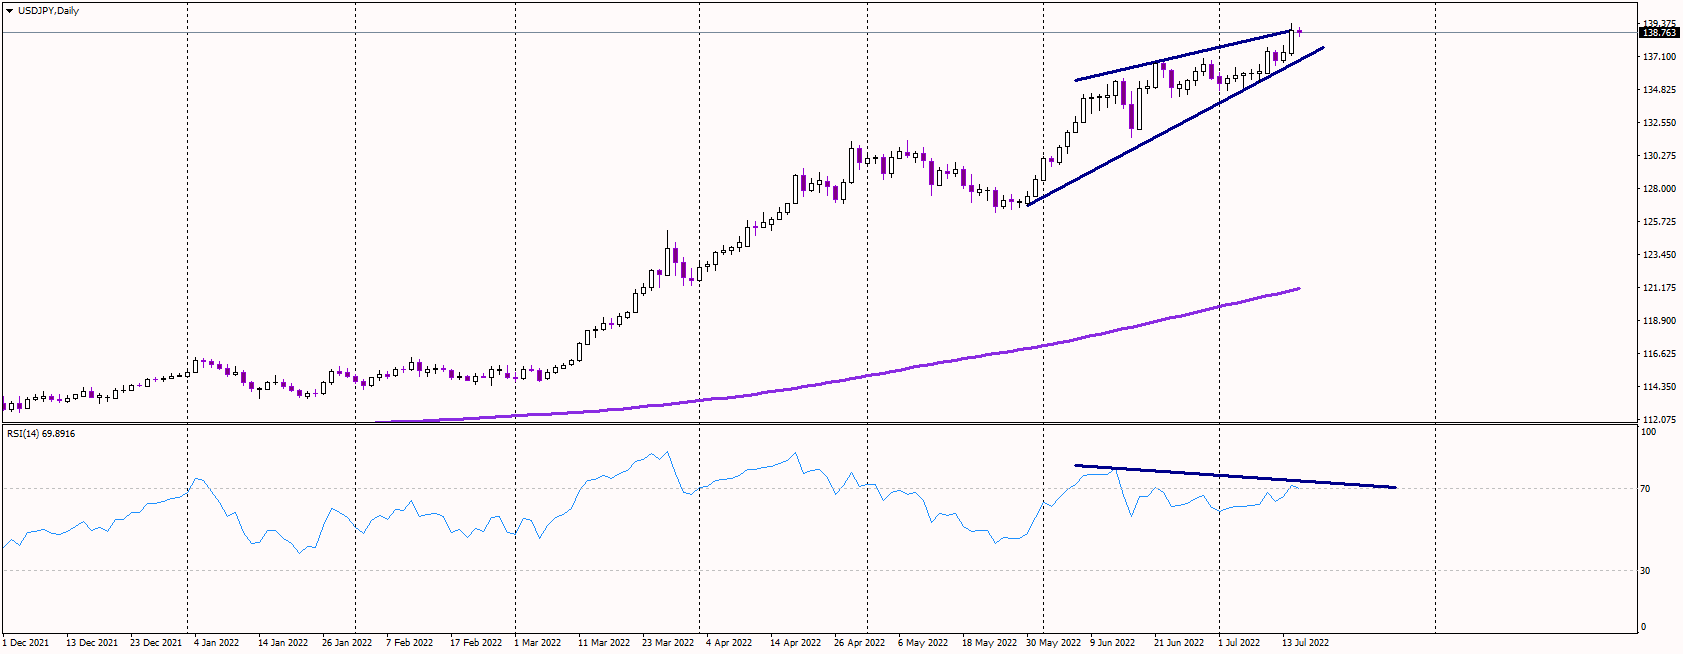
Uptrend remains intact
Technically speaking, the uptrend remains alive, with the pair rising to fresh cycle highs, confirming the bullish momentum.
However, the daily chart seems to form a rising wedge pattern, usually a bearish reversal formation. Therefore, if the pair drops below the uptrend line at 137, we might see some strong selling. In addition, there is a bearish divergence between the price and the RSI indicator, confirming the possible reversal.
On the upside, the bull's target remains at the psychological level of 140.