As the grain with the most traded volume in financial markets, Corn deserves a distinct deep dive. This article details the fundamental architecture, volatility drivers, and tactical strategies essential for engagement in trading corn.
Trading Corn via Contracts for Difference (CFDs)
Before diving into the specifics of corn, a solid understanding of how CFDs work and how they differ from buying futures contracts is required. These are some of the key features of trading corn through a CFD:
- A CFD is a cash-settled derivative. This means you never physically buy, sell, or take delivery of corn. You are speculating on a contract that is made to track the prices of corn futures in major markets. Using CFDs thus allows you to speculate on prices without having to worry about rolling over a futures contract or undertaking physical delivery.
- CFDs allow you to use leverage, enabling you to use your capital more effectively. Using leverage wisely allows you to hold multiple positions without tying up all your capital in just one asset. It also allows you to size up positions and potentially make significant profit from intraday swings that would otherwise achieve only a small percentage gain. Leverage is a tool; when used wisely, it can increase potential returns, but if used without understanding, it will amplify the size of losses.
- Unlike a physical investment, holding a CFD position past the daily market close typically incurs an overnight financing charge (or 'swap fee'). This cost makes holding positions for long periods less profitable. Therefore, the strategies discussed below are suited more for short- to medium-term trades instead of longer-term investments.
Global Architecture of the Corn Market
The Corn market is led by three dominant producers: the United States, Brazil, and Argentina. Due to their staggered growing seasons, the global corn market benefits from a constant supply flow.
The Bi-Continental Supply Landscape
North American production, led by the US, is focused within the so-called ‘Corn Belt’. This relatively small region encompasses states such as Iowa, Illinois, and Nebraska. This location has unique constraints, as it is located on higher latitudes, which limit the growing season to four and a half months. This compressed cycle means that US crops are particularly susceptible to weather events.
In contrast, Brazil and Argentina, which are situated at lower latitudes, benefit from significantly longer frost-free seasons. This helps mitigate the shock from any short-term weather events.
Understanding Brazil’s Double Crop
Brazil showcases a distinctive production cycle. Immediately following the preceding soybean harvest (typically January-February), farmers in the center-west states plant a second crop of corn. This second crop, known as Safrinha, accounts for a significant 76% of Brazil’s total production.
However, if weather delays the soybean harvest, this second planting window is immediately put at higher risk, which has led to severe yield reductions in the past, most recently a 21% yield reduction in the 2020-21 marketing year.
Corn Fundamentals
The Pollination and Silking Window
The most critical period for corn yield occurs around pollination and fertilization, which starts approximately two weeks before silk emergence. Within this narrow time window, any excessive heat or drought would cause significant yield reductions. This potential yield loss can get as high as 8% per day, for every day a stress event persists.
Demand Inelasticity
Corn’s primary industrial uses are in livestock feed and ethanol production, which are sectors that have very few practical substitutes. While wheat can serve as a feed substitute, it is almost always significantly more expensive than corn, making it economically unviable.
Inter-Commodity Correlation: Wheat & Corn
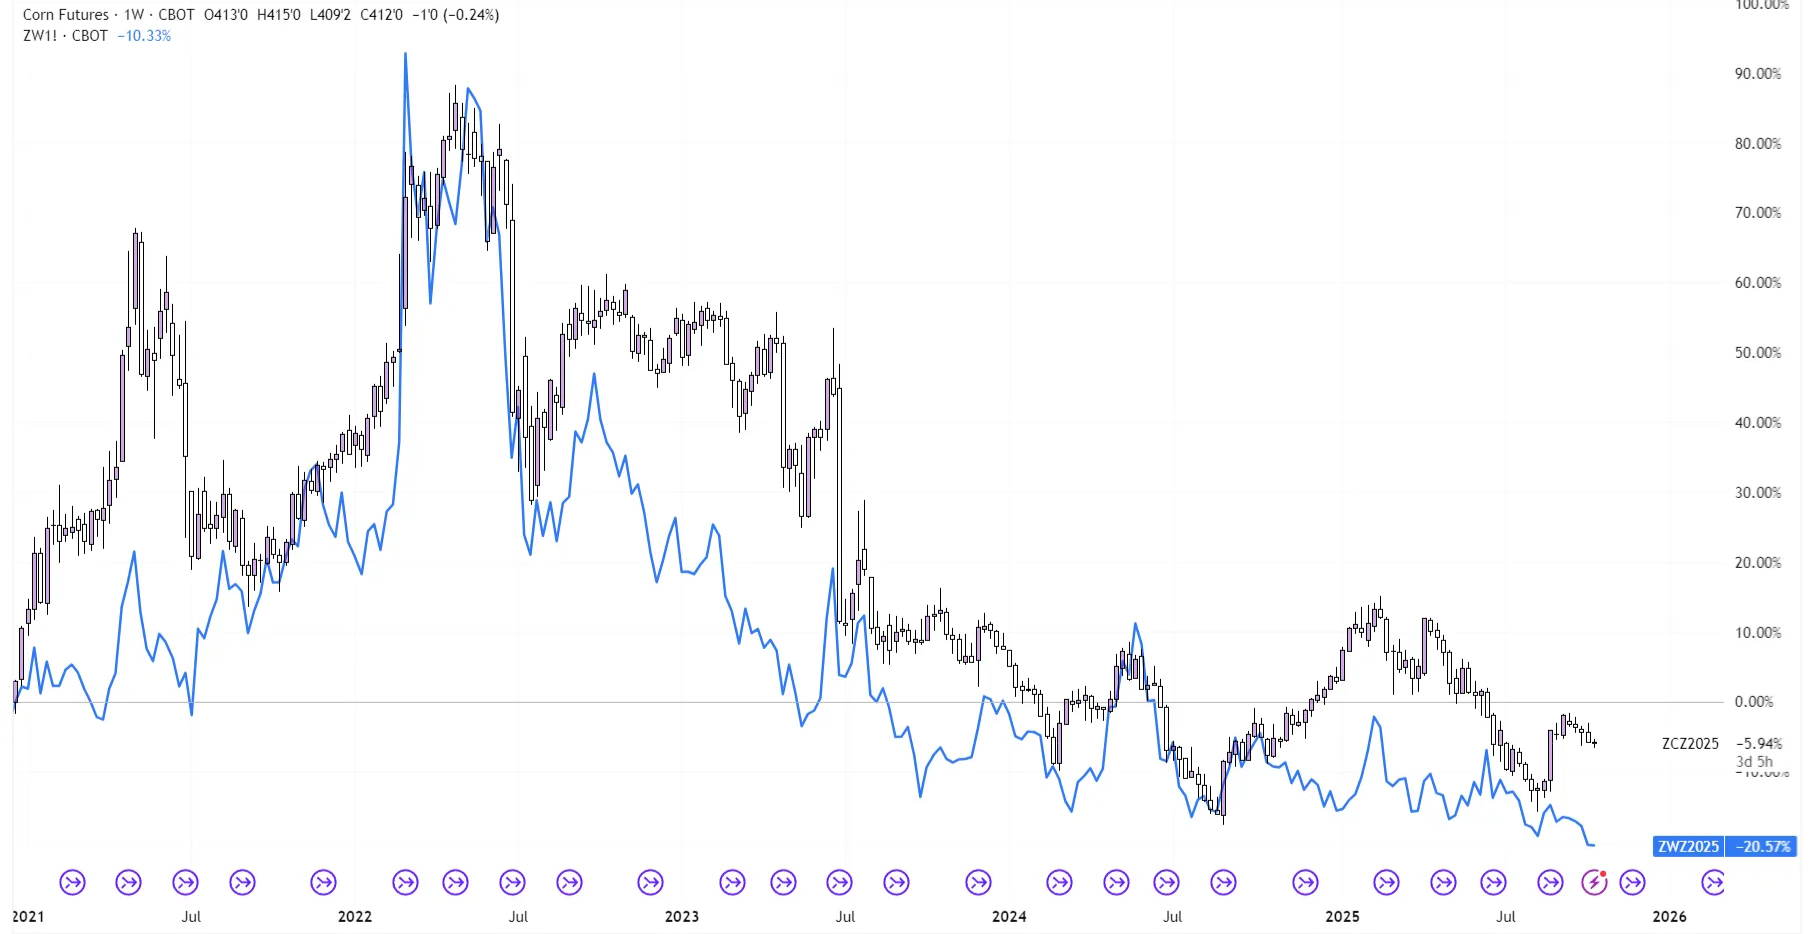
Wheat and corn prices are generally strongly correlated. The following chart will show this correlation very clearly, with Corn prices marked by the candlestick bars, and the blue line serving as Wheat prices.

This correlation is due to a confluence of factors:
- Wheat is a viable, though more expensive, substitute for corn in livestock feed. The two are strongly correlated, but wheat typically trades at a premium since it is more widely used for human food consumption and has higher nutritional properties.
- Crude oil is a major input cost in the production of both grains, further tightening their price correlation.
- While Corn and Wheat generally have non-overlapping primary producing regions (e.g., US corn in the Midwest versus US wheat in the Northwest), they both thrive in temperate climates and can thus suffer from the same large-scale weather events.
For those who want a deeper dive into Wheat and the fundamentals that drive it, we recommend going through this article, where we do just that: