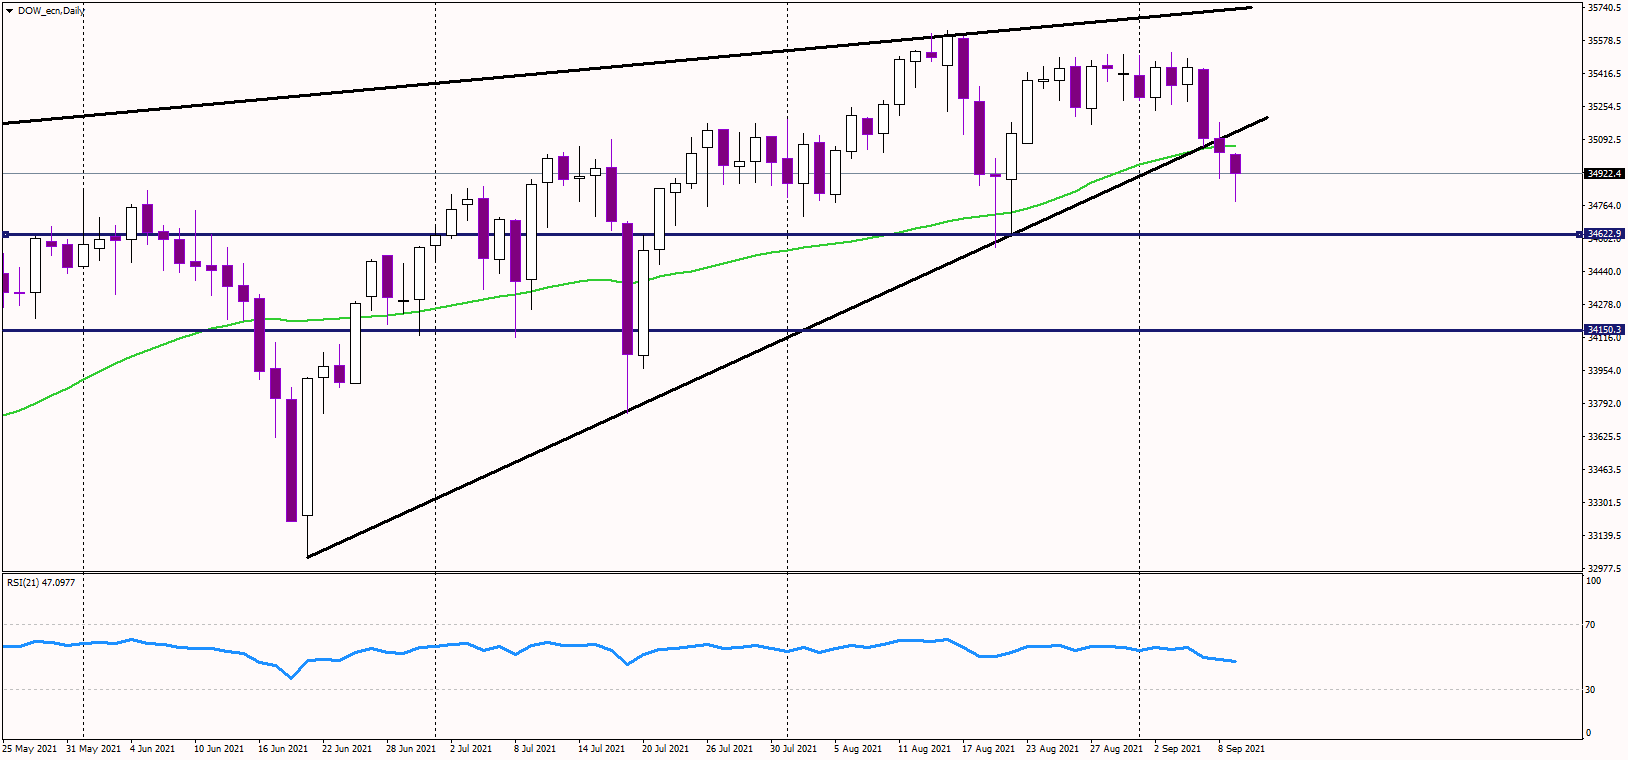
The Dow Jones index was down three days in a row on Thursday, and it was trading 0.3% lower ahead of the US session, last seen at around 34,950 USD.
It looks like the index has formed a large rising wedge formation, which is a bearish reversal pattern. In addition, the lower line of this pattern has been broken to the downside, confirming the pattern.
The Dow also dropped below its 50-day moving average at 35,080 USD, pointing to a possible correction.
The next support could be at 34,650 USD, and if not defended, bears might target 34,150 USD. The full potential of the formation is more than 1,000 USD, thus targeting July's lows at 33,750 USD.
Alternatively, the resistance now stands at the 50-day moving average, followed by another selling zone at the broken trend line near 35,150 USD.
However, the long-term uptrend remains intact, and so far, every correction has been bought aggressively. We can't rule that out as the dip-buying strategy remains favorable.