September's decline seems to be long forgotten, and US equity benchmarks have jumped sharply during this week, renewing their medium-term uptrends.
At the time of writing, the SP500 index was trading flat, waiting for the cash session to begin. It was seen at around 4,520 USD, less than 1% from the all-time highs at 4,550 USD.
The short-term support now seems in the 4,485 USD zone, and as long as the index trades above it, the outlook appears bullish. Another demand zone could be at the 50-day average, currently near 4,450 USD.
On the other hand, the key resistance now stands at 4,550 USD, and if the index closes above it on a daily chart, the long-term bull market will likely be re-established.
The earnings season has just kicked off, and so far, it looks excellent, further supporting most of the single stocks. Additionally, equities ignore rising US yields and inflation fears, proving that it is among the best assets in any scenario.

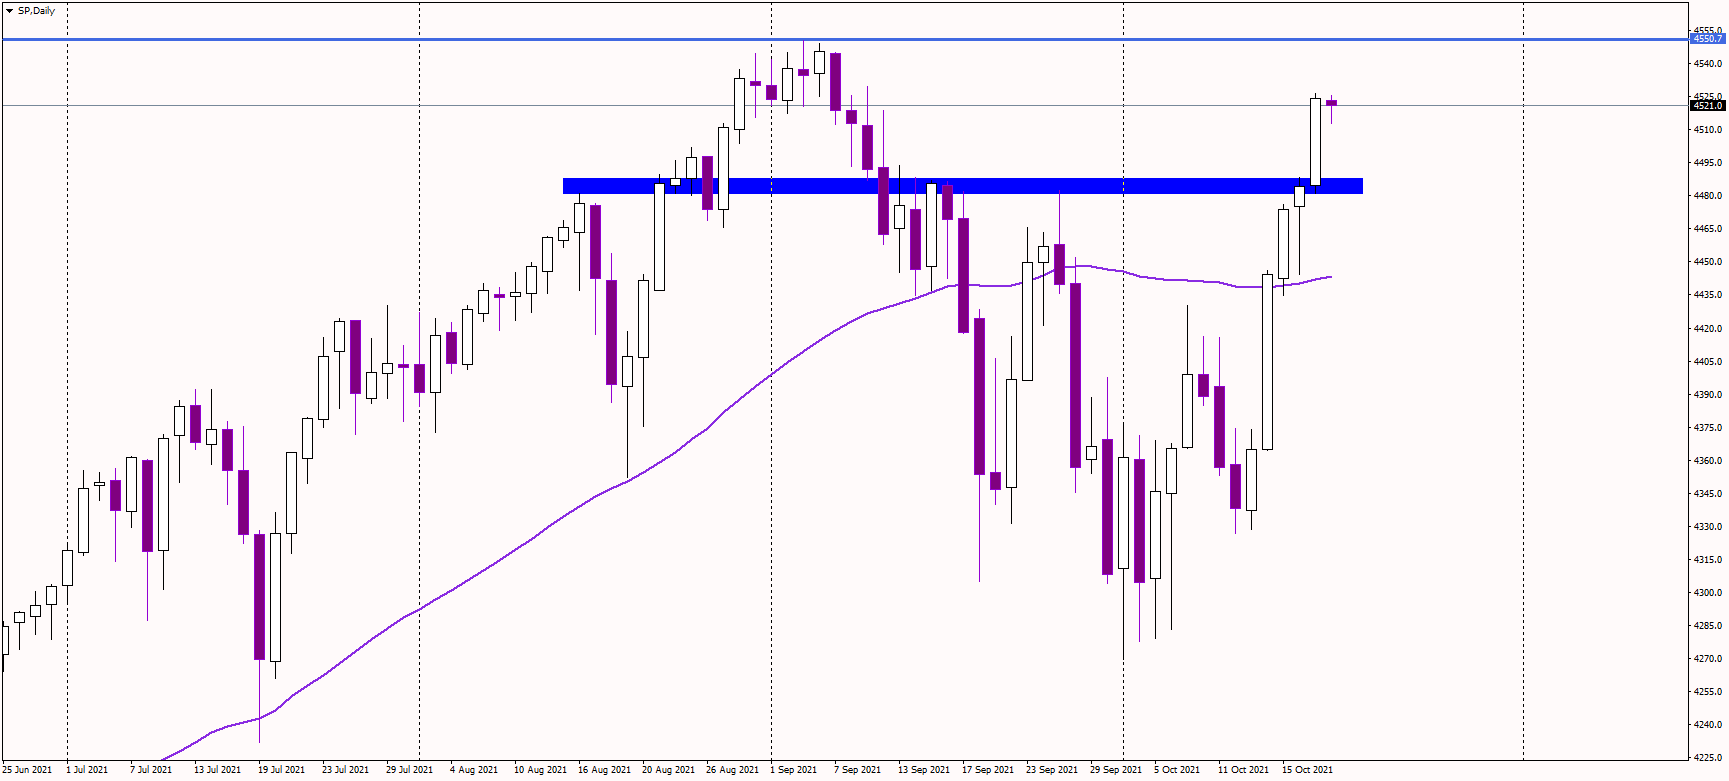
SP500 daily chart 2:30 PM CET