What Are Simple Forex Price Action Strategy Tips and Tricks?

In the Foreign exchange market, the price action describes the specifics of the price movement of a given currency pair. The Forex price action strategies involve the study of past price patterns in order to determine the possible future market movements.
 
There are dozens of popular methods to achieve this, some of them might involve complex chart and indicator analysis, however, fortunately, there are simple price action Forex trading strategies as well.
 
The essence of the first method involves the visual observation of several charts and then drawing trendlines if a trend is visible and fits the diagram naturally. If the price breaks above or below this line it can be a significant sign of reversal.
 
The second strategy also involves the chart analysis, however here traders focus on identifying the potential support and resistance levels. For visual aids, some market participants even prefer to draw a line below and above those points. The breakout above the resistance level is a bullish sign and break below the support level can point to the bear market.
 

All You Need to Know About Price Action Trading

Start Trading in 10 Minutes

Apply everything you’ve learnt on a real trading account with up to 1:1000 leverage, negative balance protection and outstanding support.
Get Started

Forex Price Action Tips and Strategies

As mentioned before there are many price action trading strategies in the FX, however in this article we will focus on the simple ones, this include:
  There is no single best Forex price action strategy. Every approach might have its advantages and drawbacks. Therefore, in order to get a better understanding of how price action strategy works in Forex, we will go through each method in more detail.


Trendline trading

A trendline is not horizontal, but a diagonal line. There are only two types of such trends. A falling line signifies that the currency pair is in a downtrend, however, if it manages to break above it, then this can be a major sign of reversal.
 
On the other hand, a rising line shows that the pair is in an upward trend. If at some point the price manages to break below it, then this might indicate that the trend has been reversed.
 
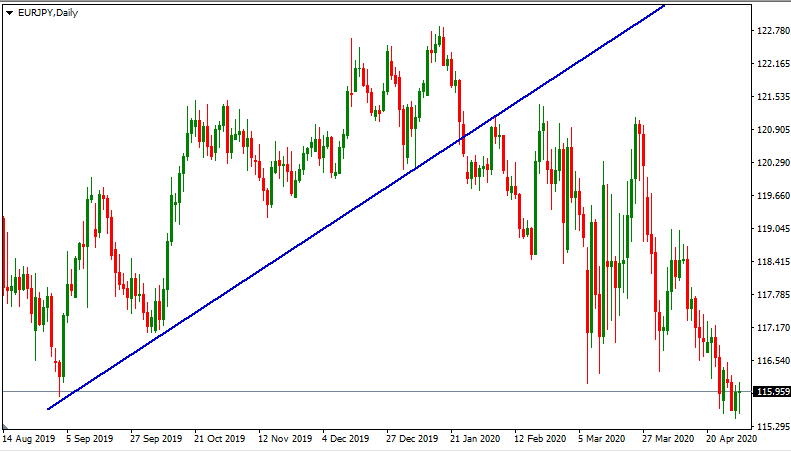
To get a better idea, how to draw the line and interpret those charts, let us move on to some real-life examples, by taking look at this daily EUR/JPY chart:
Forex price action tips and strategies

As we can see from the above, by summer 2019, the Euro was falling against the Japanese yen. The situation changes significantly from the beginning of September when EUR/JPY had a reversal and entered a clear uptrend. Throughout the next few months, the pair had at least three major pullbacks and the price got closer to the upward trend line. However, during each occasion, the Euro bounced back and reached new highs. From September 2019 to January 2020 the single currency had a strong showing, rising from 116 levels to well above the 122 mark.
 
Regardless of this development, what happened next might have been surprising for some traders. Before the end of January, the Euro started to fall dramatically, eventually decisively breaking below the upward trendline. The pair tried to rally and settle for ranged trading near the psychologically important 120 level, however, after a few weeks of fluctuation, even this support has given way and by the end of April, the pair was trading just above 115 mark.
 
So basically, this Forex price action strategy involves an analysis of several charts. Obviously, not every single currency pair is engaged in a trend. Some pairs are moving sideways and have settled for ranged trading. Therefore a trader does not have to force a trendline on a chart, where there is not a clear uptrend or a downtrend.
 
The next stage involves connecting points. In case of an uptrend, a trader has to find two bottoms and with downtrends, two peaks are needed.
 
After this, it is possible to come up with some conclusions. For example, if the price action is confined above the upward moving trendline, then a trader might conclude that this is a bullish sign for the currency pair. On the other hand, if the price breaks below this line, then it can point to reversal and can be considered as a very bearish sign.
 
The opposite is also true. Traders might consider opening the short positions for those pairs which are engaged in a downward trend. However, if the given currency manages to break above the downward trendline, then this can point to a major trend change and is generally considered to be an important bullish sign.


Trading support and resistance

As mentioned before, sometimes currency pairs settle for range trading and there are no visible signs of any trend. In this case, traders can look for two points. The support stands near the lowest point of the recent price action, where the price does not fall below this level. The resistance level is located at the high points where the given currency has not risen above that mark. After identifying those two points, traders can draw two flat lines to make support and resistance more visible on the chart.
 
For the purpose of a better illustration of how this Fx price action strategy works, let us take a look at this daily GBP/JPY chart:
Forex price action trading strategies
As we can from the above, from late December 2019 to February 2020 the GBP/JPY pair has settled for a consolidation. It was confined within roughly 140.50 to 145 range. In fact, the price tried to break out of resistance for at least 4 times, but on each occasion, it fell all the way back to 141 mark. The pair also tried to break below the lower line for at least 3 times, however, in each case, the support level held out.
 
From late February, things began to change. The final attempt to break below 140.50 level succeeded and the Pound fell dramatically. Just in a matter of a couple of weeks, the British currency traded at 124 mark against the Japanese yen. During the following trading sessions, the GBP/JPY regained some of its losses and nowadays stands near the 133 level, still well below the previous range, mentioned above.
 
So as we can see from this example, price action trading strategies in Forex are not strictly confined to trend analysis, but traders can also identify the currency pairs who are consolidating and open positions, once they break above the resistance level or alternatively below the support line.


Using 50 and 200-day Simple Moving Averages

Another simple price action strategy to trade Forex would be the use of one or several moving averages. For example, a 50-day simple moving average (SMA) is constructed by taking the closing price of a given currency pair for the last 50 business days. In general, when the price stays above the moving average, it is considered a bullish sign, however, if it falls below this line, then it is viewed as a bearish indicator.
 
One popular urban Forex price action strategy is to use 50-day SMA in conjunction with a 200-day simple moving average.
 
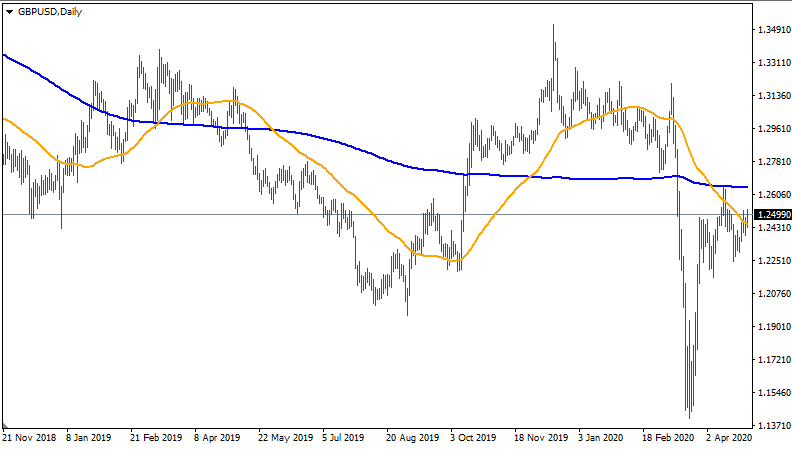
In order to see how this might look like, let us take a look at this daily GBP/USD chart:
Price action strategy to trade Forex

As we can see from this chart, by the late Autumn, 2018, the Pound was in a bear market against the Dollar.  However during the following months, the British currency managed to get above the 50-day SMA (represented by the orange line). This signaled a resurgence of GBP, which rallied for three months and eventually even overcame the 200-day Simple Moving Average indicator (represented by the blue line), rising from 1.24 to well above 1.33 level.
 
Despite those events, this uptrend was a short-lived phenomenon. By the end of April, the GBP/USD broke below 50-day SMA and shortly thereafter pierced the blue line as well. After several weeks the 50-day SMA has crossed the 200-day Simple Moving Average, which was another major bearish sign. Sure enough, by August 2019 the pair collapsed to the 1.20 mark.
 
The Pound had another round of resurgence from September 2019 to February 2020, however after the COVID-19 concerns have taken over the market and the Bank of England cut rates to record low of 0.1%, the British currency collapsed yet again, this time falling to a multi-decade low of 1.15 level.
 
Nowadays GBP/USD trades near 1.24 mark and tries to break above the 50-day simple moving average. If this happens and the Pound also pierces the blue line, then it might be a sign of major reversal. However, as long as the pair remains below those two indicators, it is still considered as a bear market and the British currency might resume its downtrend.
 
So as we can see, price action trading strategies for Forex do include the use of moving averages and quite often it might be a helpful tool to determine the trend direction and identify potential reversals.

Start Trading in 10 Minutes

Apply everything you’ve learnt on a real trading account with up to 1:1000 leverage, negative balance protection and outstanding support.
Get Started

Forex Price Action Trading Strategies - Key Takeaways

Forex price action strategy

  • Traders can benefit from identifying and drawing trendlines, not only because they can earn decent payouts from following the trend, but also by having an ability to spot potential reversals, in the case when the currency pair breaks out of this line. Some market participants prefer to use Heiken Ashi charts for this purpose since this might be easier to spot the latest trends.
 
  • Some professional traders draw two flat lines on the charts, one below the support level and one above the resistance area. This helps them to visualize the current trading range and also identify the potential breakouts.
 
  • In order to come up with more accurate analysis, some traders use 2 standard moving averages. The combination of 50 and 200-day SMA indicators is very common and when those two lines cross each other, it is usually considered as a major signal.
  • A universal best price action strategy doesn't exist. One approach can prove beneficial for one trader, whereas the same one can be disadvantageous for another. Therefore, trial and error tends to be the best way to find the most suitable price action forex strategy for you. 

FAQ: Price Action Strategies for Forex Traders

What are some of the examples of the longest-running trends in the currency pairs?

One of the longest-running trends in the currency pairs has taken place in the USD/CHF pair. By May 2001, at the high of the Dollar strength, 1 USD bought 1.79 Swiss Francs. However, after that very long downtrend began, which lasted for no less than 10 years. By June 2011, the USD/CHF had fallen to 0.79 level. Obviously, during this long period, traders using price action trading strategies to trade Forex had plenty of opportunities to earn some decent payouts.
 
However, this essentially marked an end for this trend. During the subsequent months, the US dollar regained some ground and since 2012 the USD/CHF pair is mostly confined within a tight range which formed around the 1.00 parity level.
 
Another example of this would be AUD/USD. After years of appreciation, by July 2011 the Australian dollar was trading above 1.10 level. However, after reaching such an impressive peak, the AUD entered into a downtrend which is running for 9 years and so far there are no visible signs of its end. Nowadays the AUD/USD trades near 0.65 level, which represents more than 40% decline, compared to 2011.  


During the process of drawing a price action strategy Forex trendline, does the timeframe of the chart matter?

The price action strategies to trade Forex can be applied to the charts with all timeframes, from 5-minute diagrams to monthly ones. However, some experienced traders believe that those types of analysis might be more accurate when working with longer timeframes, rather than the shorter ones.
 
The reasoning behind this is that it might take some time for the trend to take shape and for traders to reach a consensus to such extent as to take the currency pair out of ranged trading and move it to a visible uptrend or downtrend.


If a price goes below the support level is this always a very bearish sign for the currency pair?

If the spot price of any given currency pair breaks below the support line, this might not always mean that this level is broken and the market will fall further. There are many cases where the price might reach the support, however, this move might be rejected and the pair might bounce back. Therefore, experienced traders are not only looking for just one spike into the support area but for the decisive break below it, the one we have seen with the second  price action trading forex daily chart of the GBP/JPY.


Can the former resistance level play any meaningful role in the price action, after the currency pair breaks above it?

In many cases, when the currency pair overcomes the resistance level decisively, later it becomes the new support level.
 
One of the most recent examples of this would be USD/JPY. After a short-lived collapse in the middle of February 2020, the pair recovered and struggled to overcome resistance at 107 level. However, once the US dollar broker above this point, later it served as a major support area.


Why do some traders who use price action trading strategies, still lose money?

Any simple price action strategy for Forex traders can not guarantee a 100% success rate. Some traders identifying a clear trend might neglect to place a stop-loss order or at least monitor market movements regularly. If in this case, the currency movements turn to the opposite direction of the trader’s positions, then he or she might suffer serious losses.
 
Another common mistake some market participants make is to use high leverage with their trades. Even if chart analysis supports the trade, trades still need to take proper risk management seriously. This includes having a properly funded trading account, setting leverage at reasonably low levels, and not risking more than 5% of capital in any position. If a trader ignores those considerations, then he or she is always running the risk of losing the entire deposit.
 
Finally, it is clear that most price action tips and tricks are focused on Forex price action indicator tools. However, it might be worthwhile for traders to keep an eye for the latest economic announcements as well. Some events, such as interest rate decisions, the release of Gross domestic product or consumer price index reports, or other indicators quite often have a major impact on the currency movements.
Axiory uses cookies to improve your browsing experience. You can click Accept or continue browsing to consent to cookies usage. Please read our Cookie Policy to learn more.