How to Trade with the Donchian Channel Indicator

Forex trading charts are very hard to understand sometimes, which is why a more focused tool is required to see all of the relevant trends and look through the volatility. The donchian channels definition lies right here in the simplification of FX charts and the way we take information from them.
 
The most basic explanation is that the donchian channel highlights the low and high exchange rates of a financial instrument over the course of several time frames. The time frame can be chosen by the trader themselves and the tool will calculate what to show that will be useful.
 
To put it even more bluntly, the donchian channel helps traders see some kind of order in the mess that is volatility in Forex. Overall, it helps highlight the growth potential of a specific currency pair as well as the actual growth.
 
Most donchian channel trading strategies revolve around looking at the actual growth of an asset, but this depends on the timeframe used during analysis. If the timeframe is a week, then looking at potential growth is more important than actual growth. If it’s a year or so, then actual growth becomes more important.
 
In this guide, you will learn how to use the donchian channel and what mistakes to avoid when you install it on your trading software.

Start Trading in 10 Minutes

Apply everything you’ve learnt on a real trading account with up to 1:1000 leverage, negative balance protection and outstanding support.
Get Started

What is donchian channel?

As already mentioned, the primary purpose of the donchian channel is to help us see through the volatility. For example, when we look at a regular chart, it may get a bit hectic with all of the green and red candlesticks. With this indicator enabled we are able to see where an instrument has reached its maximum potential, and how long it took for that maximum potential to be bested.
 
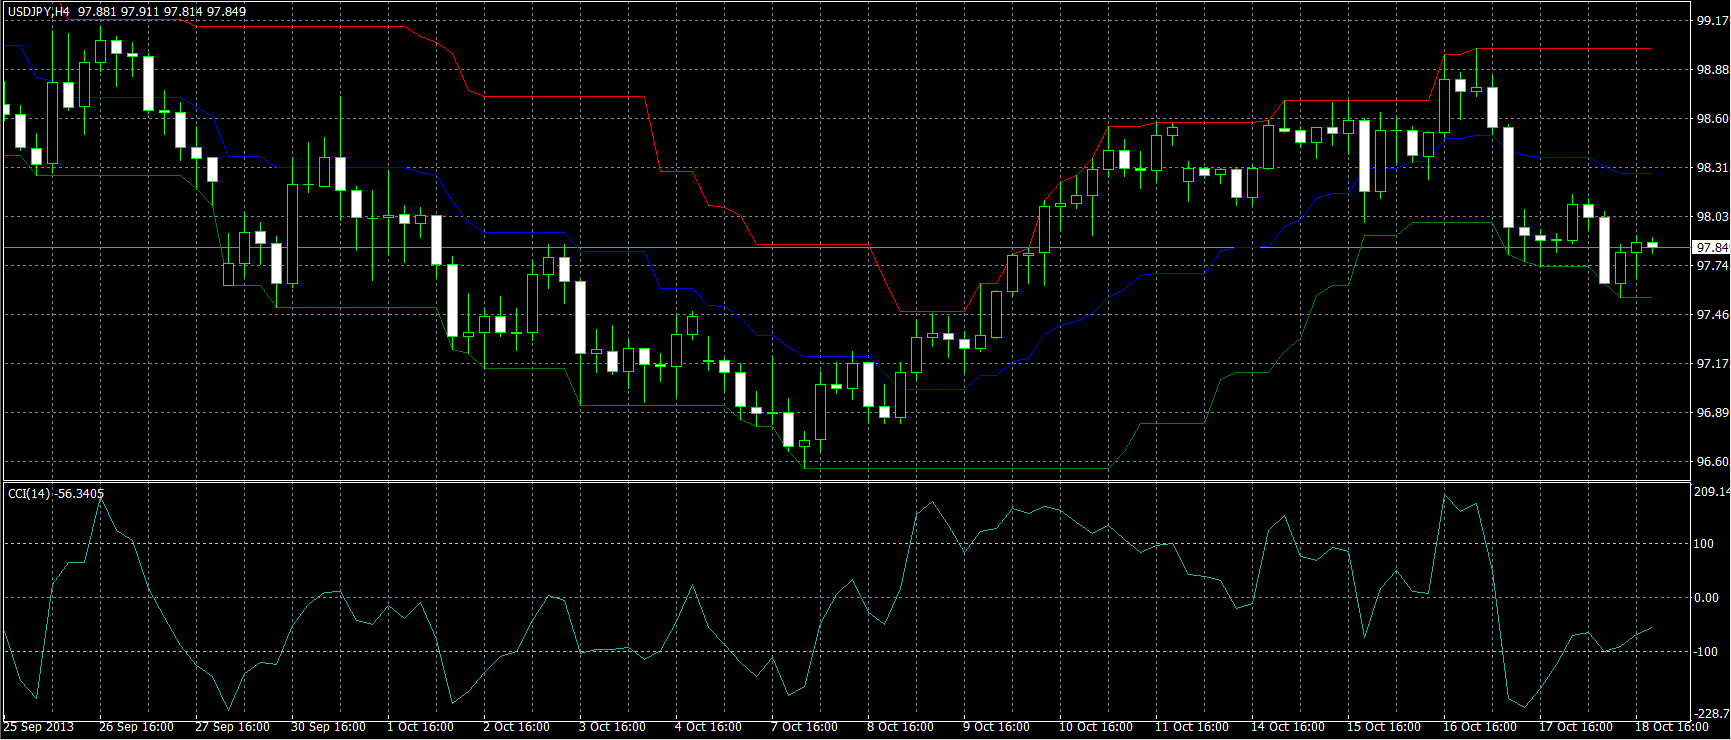
For example. Let’s say that the USD/JPY exchange rate reached its maximum potential at 100, but then started to fall in the coming days. The donchian channel would help us see this failure to overcome a resistance level with a flat line. But this wouldn’t be a donchian channel indicator tutorial if we didn’t visualize the tool.
What is donchian channel
 
As you can see from the chart there are three lines that you can follow. In our guide, we need to focus only on red and green. First, let’s focus on the red. The timeframe chosen for this specific chart was H4 so it helps us see the comparison of each highest mark in the 4-hour segments.
 
As you can see it starts off strong, but slowly declines and grows again. The red line helps us see when there was no challenge to the previous segment’s “high point” by displaying a flat line while everything else is pretty easy to understand.
 
The donchian channel Forex indicator helps us look through the volatility of the FX market and see a much bigger picture, but that’s only from the top line. The top line shows the potential growth for the asset. Let’s focus on the lower green line which shows us the actual growth.
 
The main difference here is that the green line shows the lowest points of each 4-hour segment. This helps us see the actual growth of the instrument that it had from point A to point B. In this chart’s case, there is no growth, there’s a loss.
 
By taking all of these 3 lines that we see on the chart, the top, the low and the middle traders can judge where it’s best to place their pivot points or where their next TP or SL points would be.
 
The most important things the donchian channel highlights:
 
  • The real growth of a financial instrument
  • The volatility of the asset
  • Highest and lowest points in a timeframe to avoid


How to use donchian channel indicator

The donchian indicator may look quite easy to use, and it is most definitely the case with experienced traders. But when it comes to beginners it may be a bit hard to use it effectively.
 
There are numerous mistakes that have been observed with the donchian indicator that beginners tend to make, so let’s make a list where they are all explained and highlighted. This will help you avoid them as well as see the donchian channel as something much more than previously described.


Mistake 1: not using other tools with the donchian channel

The first mistake is not something only donchian users make unfortunately, it’s present with other tool users as well. The real answer to the question “how to use the donchian indicator” is that you need to pair it up with other tools as well.
 
Once the indicator highlights the market performance for you, it is time to add in other information such as the volume indicators and pivot points. Pairing up these tools will most definitely assist in making the most educated guess.


Mistake 2: Choosing small timeframes

Another mistake that we see beginners make is going for smaller timeframes. This strategy is completely fine on its own, but when combined with the donchian channel, it may get a bit tricky. You see, the most optimal way that has been tested for trading the donchian channel is going for longer timeframes simply because you get to see the actual growth much better. Smaller timeframes only show potential growth, which can be deceiving when trying to place the most accurate guess.


Mistake 3: Trusting donchian too much

The donchian channel is not something that takes data, calculates it and gives you some kind of analysis. It’s a completely visual tool that helps you better understand the market rather than having the tool understand the market for you.
 
Because of this, it may not be the best idea to trust donchian too much. If it shows that there is potential for the growth to be 10 times what it is now, it may not necessarily be the case.

Start Trading in 10 Minutes

Apply everything you’ve learnt on a real trading account with up to 1:1000 leverage, negative balance protection and outstanding support.
Get Started

Donchian channel indicator guide - Key takeaways

The donchian channel indicator is a tool that helps traders look through the complex visual aspects of the volatility that can be found in the financial markets. All of the “hard-to-understand” candlesticks which sometimes have very weird shapes for beginners to truly grasp are removed from the equation almost instantly and given a much more reliable graph of most growth and decline. This tool is best for looking at how some trading sessions begin and finish, thus giving traders a slightly clearer picture when it may be the best to place trades.
 
The donchian channel is definitely not a complex tool, but it may be deceiving. It’s important to know that it does not calculate anything, it simply gives a better visual representation of the data. The donchian channel’s usage in trading is maximized by giving it large timeframes, but in most cases, traders have been seen relying on 50-day timeframes for a better understanding of trends.
 
The donchian channel is a background tool, which means that it is not as effective alone as it is with other tools supporting it. The most useful tools that could potentially be added to your donchian trading strategy are the volume indicator and Pivot Points.

FAQ on what is donchian indicator

Where can I get the donchian indicator?

There are many websites where you can download the donchian channel indicator from, but so far the most reliable platform is the MetaQuotes marketplace. You can go directly to the website, or simply Google search donchian channel download and it will most likely be the first result.
 
Once you have downloaded the file it will be time to install it on your device as it does not have automatic installation, unfortunately. Here are the steps you need to follow.
 
  1. Find downloaded donchian channel file
  2. Copy and paste it in the files here: Metatrader 4 > MQL4 > Indicators
  3. Restart your MT4 software if you already had it launched
  4. Find the donchian channel MT4 indicator like this: Insert > Indicators > Custom > Donchian


Why should I use the donchian indicator?

Looking at the MT4 charts may sometimes be very confusing especially when you are a beginner. The donchian channel will help you see past the chaos that is candlesticks and highlight the trends that are happening right now or have happened before.
 
The reason why you should use the donchian indicator is that it helps with looking past the hype that may surround the growth of an asset. For example, the growth during the last two weeks may have been amazing, but the actual growth of the last month is still in the negative. The donchian channel breakout would be highlighted with the tool and help traders understand that it may still be a good time to enter a trade.


What is a donchian channel breakout?

A donchian breakout is pretty much like any other breakout, it’s just labeled this way because the tool helps us see it so much better.
 
Whenever you see that the top line of the donchian channel suddenly stops the flat line, it means that there is a serious breakout in the making. All that has to be done at that point is to compare the breakout to the potential growth of the instrument. If it’s currently below the potential, it may be good to enter the market.
Axiory uses cookies to improve your browsing experience. You can click Accept or continue browsing to consent to cookies usage. Please read our Cookie Policy to learn more.