Top 5 Fundamental Indicators for Stock Trading
There are several fundamental indicators that every trader should pay attention to while trading in the stock market. Based on studies, in most cases, momentum traders like to focus on earning and net income. This is mainly because usually, earnings and net income reflect the fundamentals of the company.
The instruments that traders may use for fundamental research differ based on the item being traded. For example, stock traders may examine the data in a company's earnings report, such as sales, earnings per share (EPS), predicted growth, profit margins, and so on. All these are some of the most important stock indicators in the stock market. We will be focusing on several essential fundamental indicators such as ROE (Return on Equity), EPS (Earnings Per Share), DYR (Dividend Yield Ratio), FCF (Free Cash Flow), and PEG (Projected Earnings Growth).
ROE (Return on Equity)

ROE (Return on Equity) is an important indicator in the stock market. Return on equity is a measure of how efficient a company is in producing a profit for its shareholders. ROE is net profit divided by shareholders’ equity. Usually, the higher the Return on Equity, the more efficient the company is to generate profit for its shareholders.
Let’s look at a real-life example. Let’s suppose we have two companies: A and B. A has equity of 10 million dollars, while B company has equity of 100 million dollars. Both companies made 1 million dollars for the same year. Although they are equally profitable, we can see that ROE for Company A (10%) is so much better than ROE for company B (1%). This means that A company is more efficient in producing profit for shareholders. It is able to produce the same profit with much fewer resources. The range of Return on Equity can defer greatly across different industries.
EPS (Earnings Per Share)
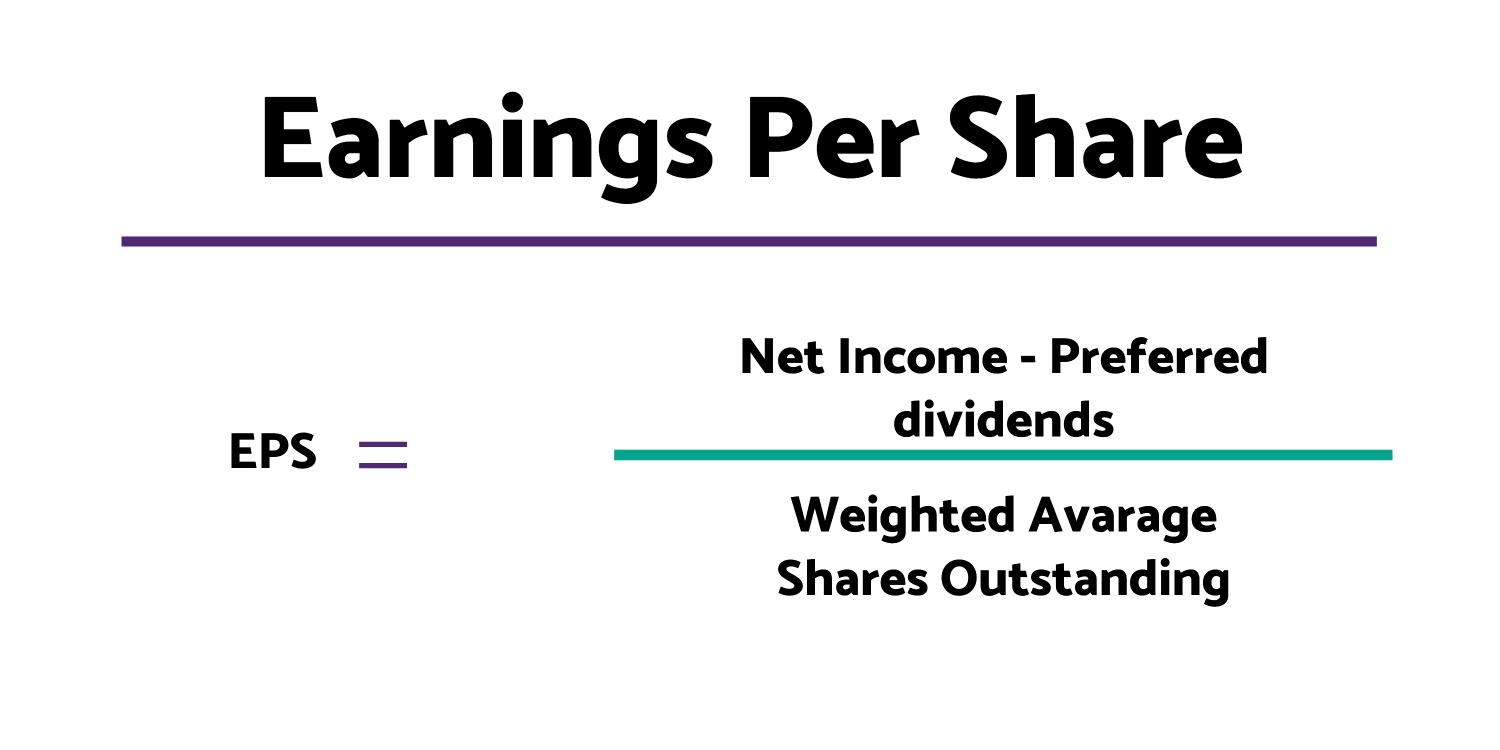
Earning per share is also another important indicator on the list of fundamental stock indicators. Earnings per share are calculated by taking the net income of the company and dividing it by shares outstanding. Assuming if the company has no preferred dividends to payout. If it does, then in this case EPS is calculated by taking the difference between the net income and the preferred dividends and then dividing that result by the number of outstanding shares.
Let’s take another example considering there are two companies: A and B. Let’s suppose company A and B both have a hundred million dollars in earnings and neither of these companies are issuing any preferred dividends. Company A has 100 million shares outstanding and company B has 50 million shares outstanding.
The question is, which company has a higher EPS value? In this case, the EPS value for company A is gonna be the earnings divided by a number of shares, which is 10 dollars per share. On the other hand, in the case of company B, the EPS value will be 2 dollars per share. If everything else is similar with these two companies, we can say that company A is a better deal than company B so a trader will buy the stock of the first company rather than the second.
DYR (Dividend Yield Ratio)
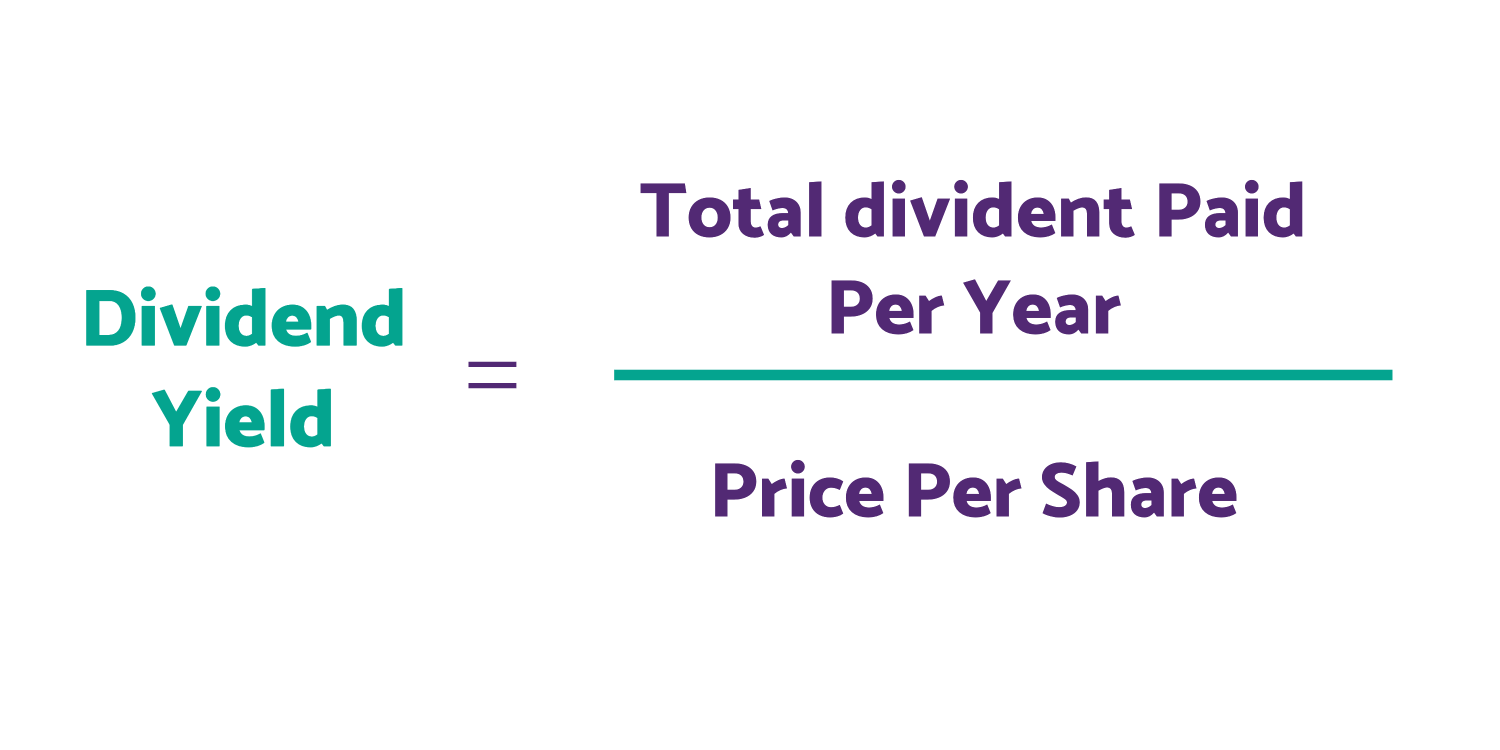
One of the fundamental indicators for stock trading is DYR, the same as the dividend yield ratio. It is calculated by dividing the total dividends by the net income or dividend per share by earning per share. The formula is pretty easy but the trick, in this case, is to use the right numbers in order for the fundamental analysis to be meaningful. The investors should get these numbers from the company's financial statements.
Dividend Yield Ratio is a ratio that tells you how much dividend per share you are going to get for the per-share price of the company. For example, if the price per share of the specific company is 200 USD and the dividend per share is 5 USD this will mean that the Dividend Yield Ratio of the company is 2.5%. This is how DYR is calculated in the stock market. It should be noted that in different industries and in different companies, there are different yields.
FCF (Free Cash Flow)
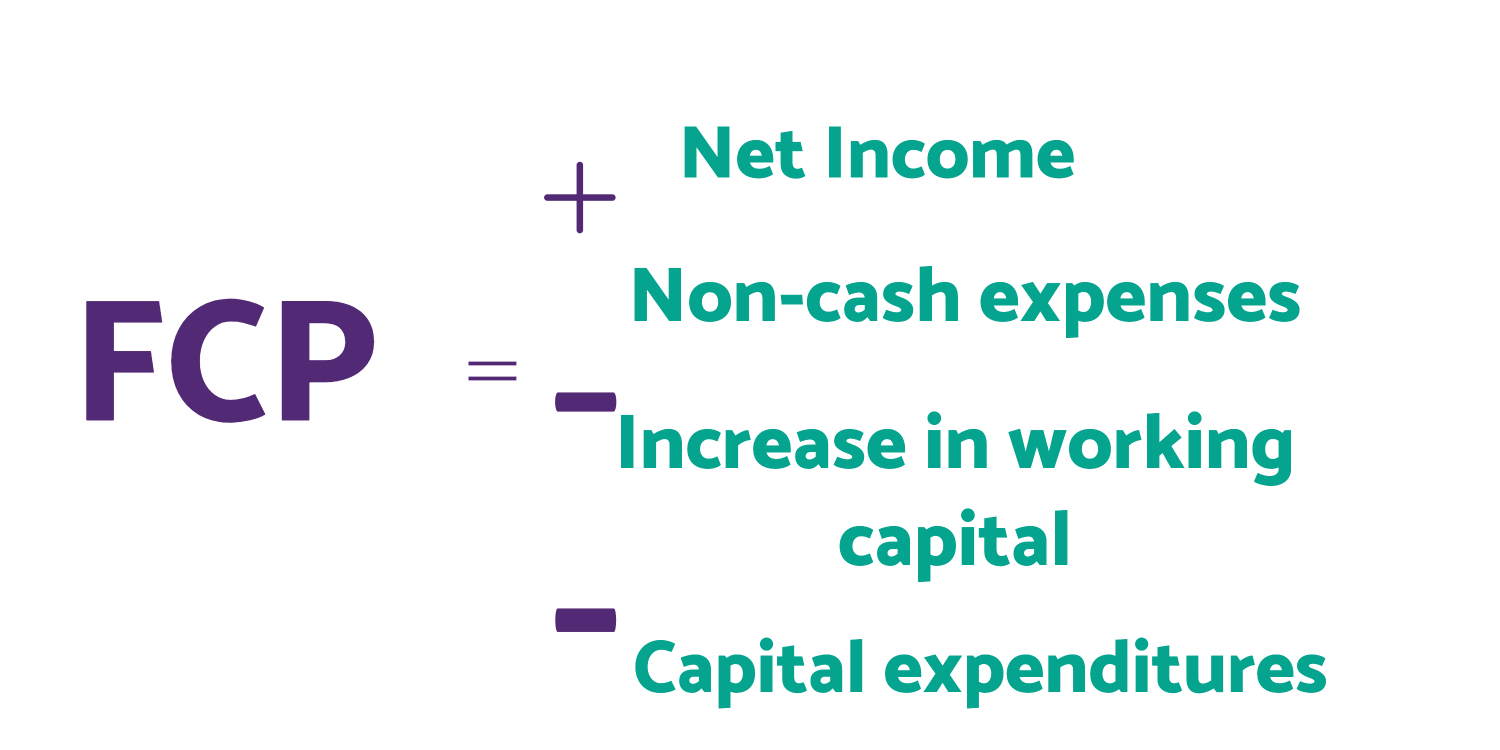
While talking about trading stocks with fundamental indicators another noticeable indicator that should definitely be mentioned is Free cash flow. FCF is defined as cash flow that is available to the firm's investors. This includes bond investors and stock investors. To illustrate, let's take a look at an example.
Cash comes into the company in the form of revenue as it sells its products or services. The company then takes that cash and pays operating expenses for things like salaries. Next, the company makes short and long-term investments. Short-term investments include things like inventory and receivables. They call this working capital. While long-term investments would account for things like investments in their property plant or equipment, often called PP&E for short. What remains is the firm's free cash flow eligible to be paid out to the company's investors. Often this is called free cash flow to the firm.
The company is obligated to take care of the bond investors. Since bond investors are higher up the pecking order and stock investors. So with their free cash flow to the firm, they pay the interest they owe to the bondholders. They may also pay bond principal, or perhaps even borrow more money with new bonds if they choose. So after all bondholders are taken care of, what remains is known as a free cash flow to equity.
PEG (Projected Earnings Growth)
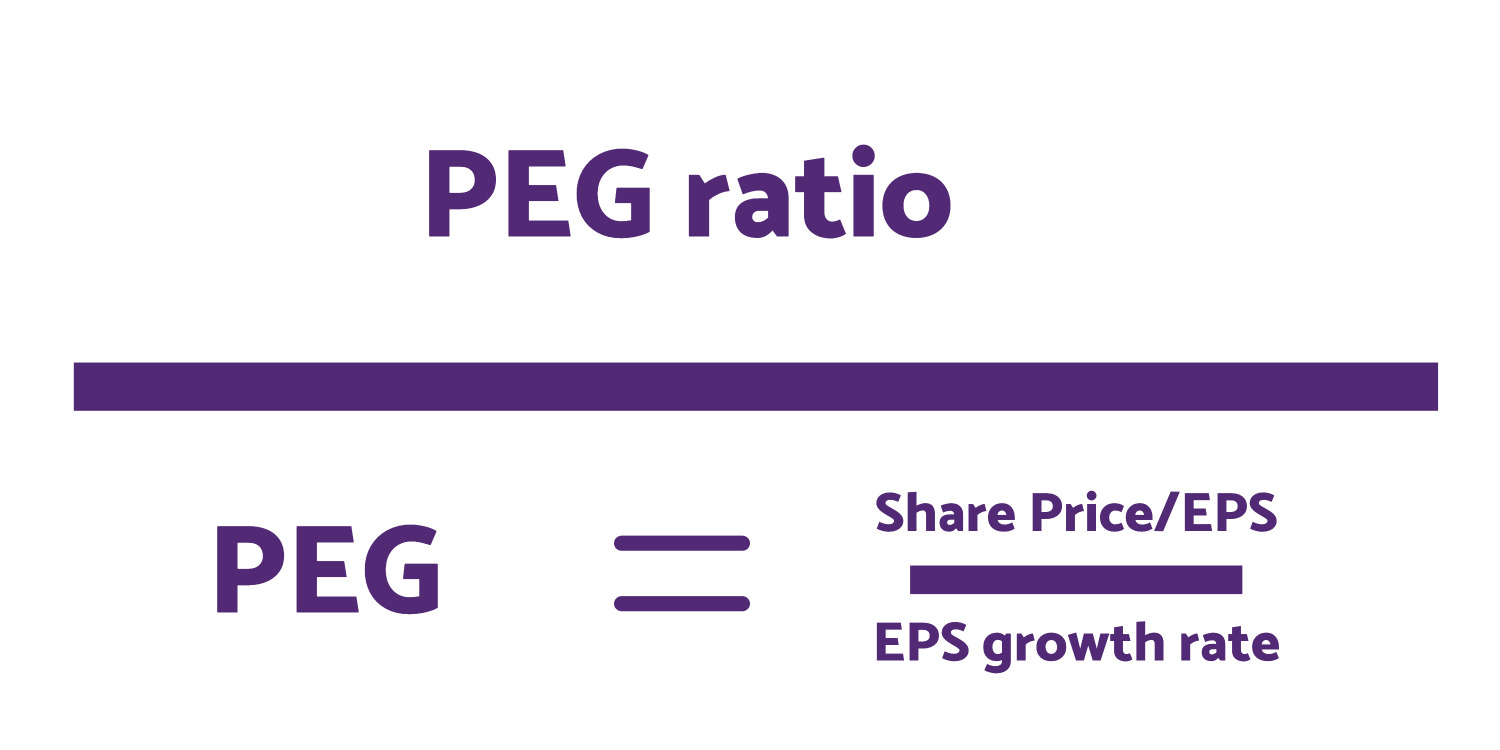
PEG, the same as Projected Earnings Growth, is on the list of fundamental stock indicators. PEG uses the P/E ratio and takes one step further. We know that the P/E ratio is one way to tell us whether the stock is cheap or expensive. It is the relationship between the current share price and one year’s earnings per share. On the other hand, the PEG ratio is a relationship between the P/E ratio and the firm’s earnings per growth rate. Let’s suppose we have a company with a P/E ratio of 10, we also know that the earnings per share of this company is 10 p now and is expected to be 12 p.
This means that the expected earnings growth rate is 20%. Overall, the Projected earnings growth rate is 0.5 in this hypothetical scenario. In this case, the number reveals that the share of the company is cheap. Usually, it means that if the Projected earnings growth rate is less than 1 traders buy the share. On the other hand, if the Projected earnings growth rate is above 1, they sell the share. This is how the PEG fundamental indicators for stock trading work in the stock market.
Price-To-Book-Ratio (P/B)
Comparing the market value of the company to its book value is always a good idea to define how overvalued or undervalued the company is. The P/B indicator is an effective indicator to measure whether a stock is overvalued or undervalued based on its net asset value.
Use for traders: Using the P/B ratio, traders can identify potential discrepancies between a company’s market value and its net asset value. If P/B is below 1 then the stock is undervalued and if it's higher than 1 then it indicates the stock is overpriced and might be a good time to search sell signals.
User for investors: A low P/B ratio can attract investors to invest in a company that has undervalued stocks.
Dividend Payout Ratio
DPR is used to measure the percentage of earnings paid out as dividends. The indicator not only offers a wider view of how stable the company pays dividends but also helps understand the sustainability of a company’s dividend payments.
Use for traders: Traders use DPR to gauge the stability of a company’s dividend payment. Sudden fluctuations in the DPR can influence short-term price movements, which is always beneficial for traders.
User for investors: Evaluating the sustainability of dividend payments for a specific company is always a priority for investors, as they are more likely to search for stable dividend-payer companies. For some long-term investors, dividends are the main source of income.
Price/Sales Ratio
Comparing market capitalization to total revenue is useful to define if the company has sales corresponding to its value. Price/Sales Ratio is used for evaluating a company’s valuation relative to its sales performance. This is yet another method to find out if its sales performance undervalues the company. If the company is undervalued while its sales are jumping, it may be a good time to look for a long entry. Investors can use this ratio to increase their confidence in their investments.
Use for traders: Traders can use this indicator to assess whether the stock price of a company is undervalued or overvalued. This can be a good indicator for traders interested in short-term gains.
User for investors: Price/Sales ratio can strengthen investor confidence if they see the company is performing well while its stock is not caught up yet.
Book value Per Share
The indicator shows equity value per outstanding share and offers insights into the intrinsic value of the company’s stock.
Use for traders: Traders can assess the intrinsic value of the stock using BVPS in the evaluation of potential undervalued stocks looking for buying opportunities. The Opposite is true when looking for stocks that can be shorted.
User for investors: This indicator can be used by investors to evaluate a company’s financial health and overall value. Investors are always trying to invest in undervalued stocks for longer terms than traders.
Quick Ratio (acid test ratio)
QR measures the short-term liquidity excluding inventory. It provides a more conservative measure of a company’s ability to cover short-term liabilities. It can also be a good indicator if the company has shortcomings regarding managing its shorter liabilities and paying them.
Use for traders: Sudden changes in a company’s short-term liquidity and its ability to cover immediate liabilities can be a good indicator for stock traders to capitalize on short-term movements.
User for investors: Investors, on the other hand, can use a quick ratio to gauge a company’s financial health and its ability to meet short-term obligations. The indicator should be above 1 to indicate good short-term liquidity.
Inventory Turnover
How quickly a company can sell and replace its inventory is the main question Investors' Turnover formula answers. The indicator shows the efficiency of the company in managing and selling inventory. If the company manages it well, then it might be a bullish signal as it indicates the company is performing well.
Use for traders: Traders can use this indicator to signal good short-term trading opportunities, as increasing inventory turnover is a bullish sign while decreasing indicates bearish tendencies.
User for investors: By evaluating a company’s operational efficiency long-term investors can define how well the company is managed. Consistently high inventory turnover suggests strong performance and effective inventory management.