
Stock of the day: Alibaba
15 August 2025
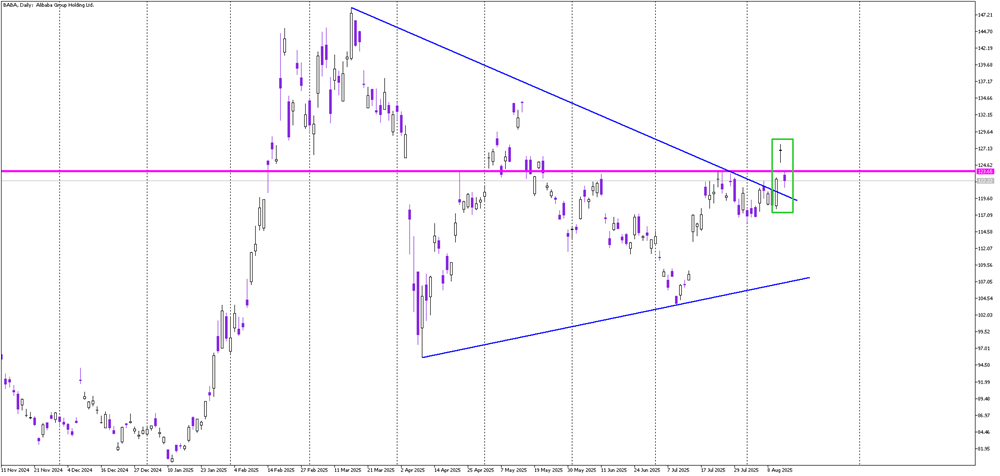
In today’s stock of the day, let’s take a closer look at Alibaba, which has just printed a very negative candlestick formation – the Abandoned Baby. This is a rare but powerful three-candle reversal pattern, and on the chart, it’s marked with green color. The setup is textbook: first, a strong bullish candle, then a bullish gap leading into a doji, followed by a bearish gap and a solid bearish candle.
What makes this formation even more concerning is its location. The pattern forms just above the key $123.60 support, a level that acted as resistance in June and July. The doji itself represents a false breakout above this level, and the immediate reversal adds weight to the bearish case.
Now, one step remains before we have a full-fledged sell signal: a return inside the symmetric triangle marked with blue lines. If price closes the day back inside that formation, it would confirm the bearish outlook and likely trigger a deeper move to the downside.