
Stock of the day: Ford
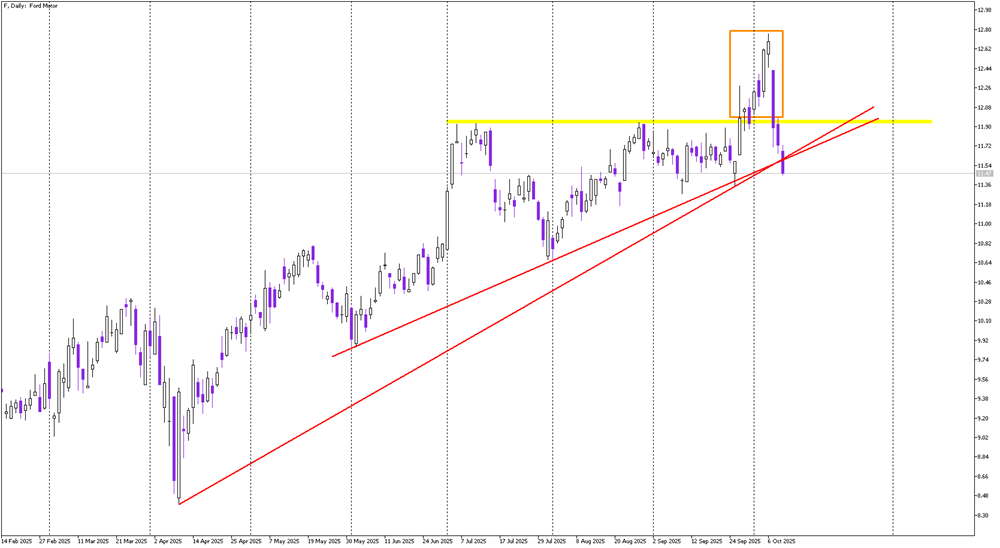
The yellow horizontal line marks the upper boundary of the ascending triangle — a level that was acting as a strong resistance for a few weeks. Last week, Ford’s price managed to briefly break above this level, suggesting that buyers were taking control. However, this breakout proved to be false, as indicated by the orange area marking the failed bullish attempt. The price quickly fell back below the resistance, invalidating the bullish move and signaling a trap for buyers.
Since that rejection, the market has turned decisively bearish. The last three sessions have been dominated by strong red candles, showing heavy selling pressure and confirming that the false breakout was not just a short-term correction but a major shift in sentiment. The drop was further intensified by a break below the lower boundary of the triangle pattern — a clear technical confirmation that the structure has failed.
As long as the price remains below the yellow resistance, the outlook for Ford remains negative. A sustained move back above this resistance would be needed to neutralize the bearish scenario, but for now, the sellers are firmly in control. The technical picture points toward a continuation of the downtrend, with momentum clearly favoring the bears.