
Stock of the day: Netflix
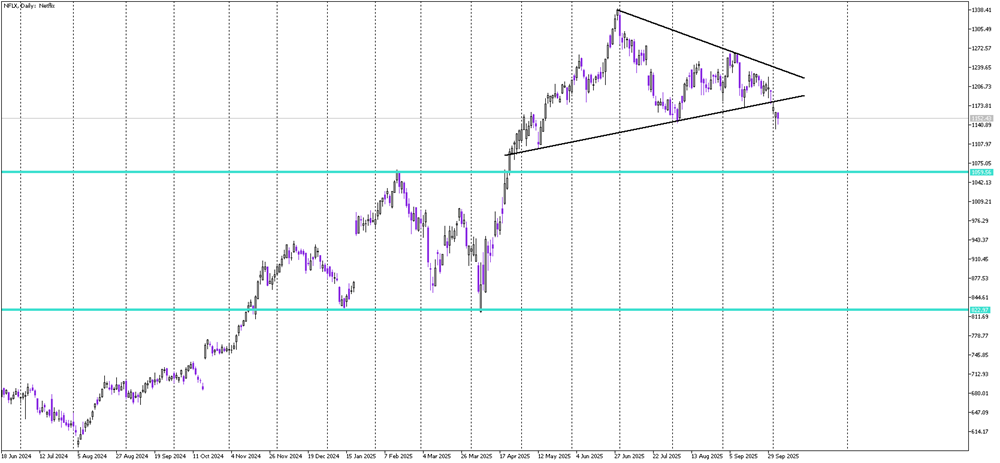
From a technical standpoint, the current price drop is visible, but it’s not unprecedented — in fact, the decline in July was much steeper and entirely technical in nature, unrelated to any external controversy. Right now, the chart shows a breakout to the downside from a symmetric triangle pattern, marked with red lines. This escape below the formation is a bearish signal, and as long as the price remains below the lower boundary of the triangle, the sentiment stays negative. The next potential target for sellers lies around the 1,060 USD area, which aligns with the first horizontal support zone.
For the buyers, the outlook remains uncertain. To invalidate the current bearish sentiment, Netflix would need to stage a comeback — specifically, the price would have to climb back inside the triangle and break above the upper red line, which would serve as a proper signal to buy. However, as of now, such a reversal seems unlikely, and the bias remains tilted to the downside. Despite the noise around Musk’s boycott, Netflix’s weakness still looks more technical than fundamental — but it’s a weakness nonetheless.