One pair that has been somewhat overlooked recently is GBP/USD. However, its decreased volatility doesn’t mean there are no opportunities. Often the best opportunities are found in assets when they are still calm, getting on board before everyone else piles in.
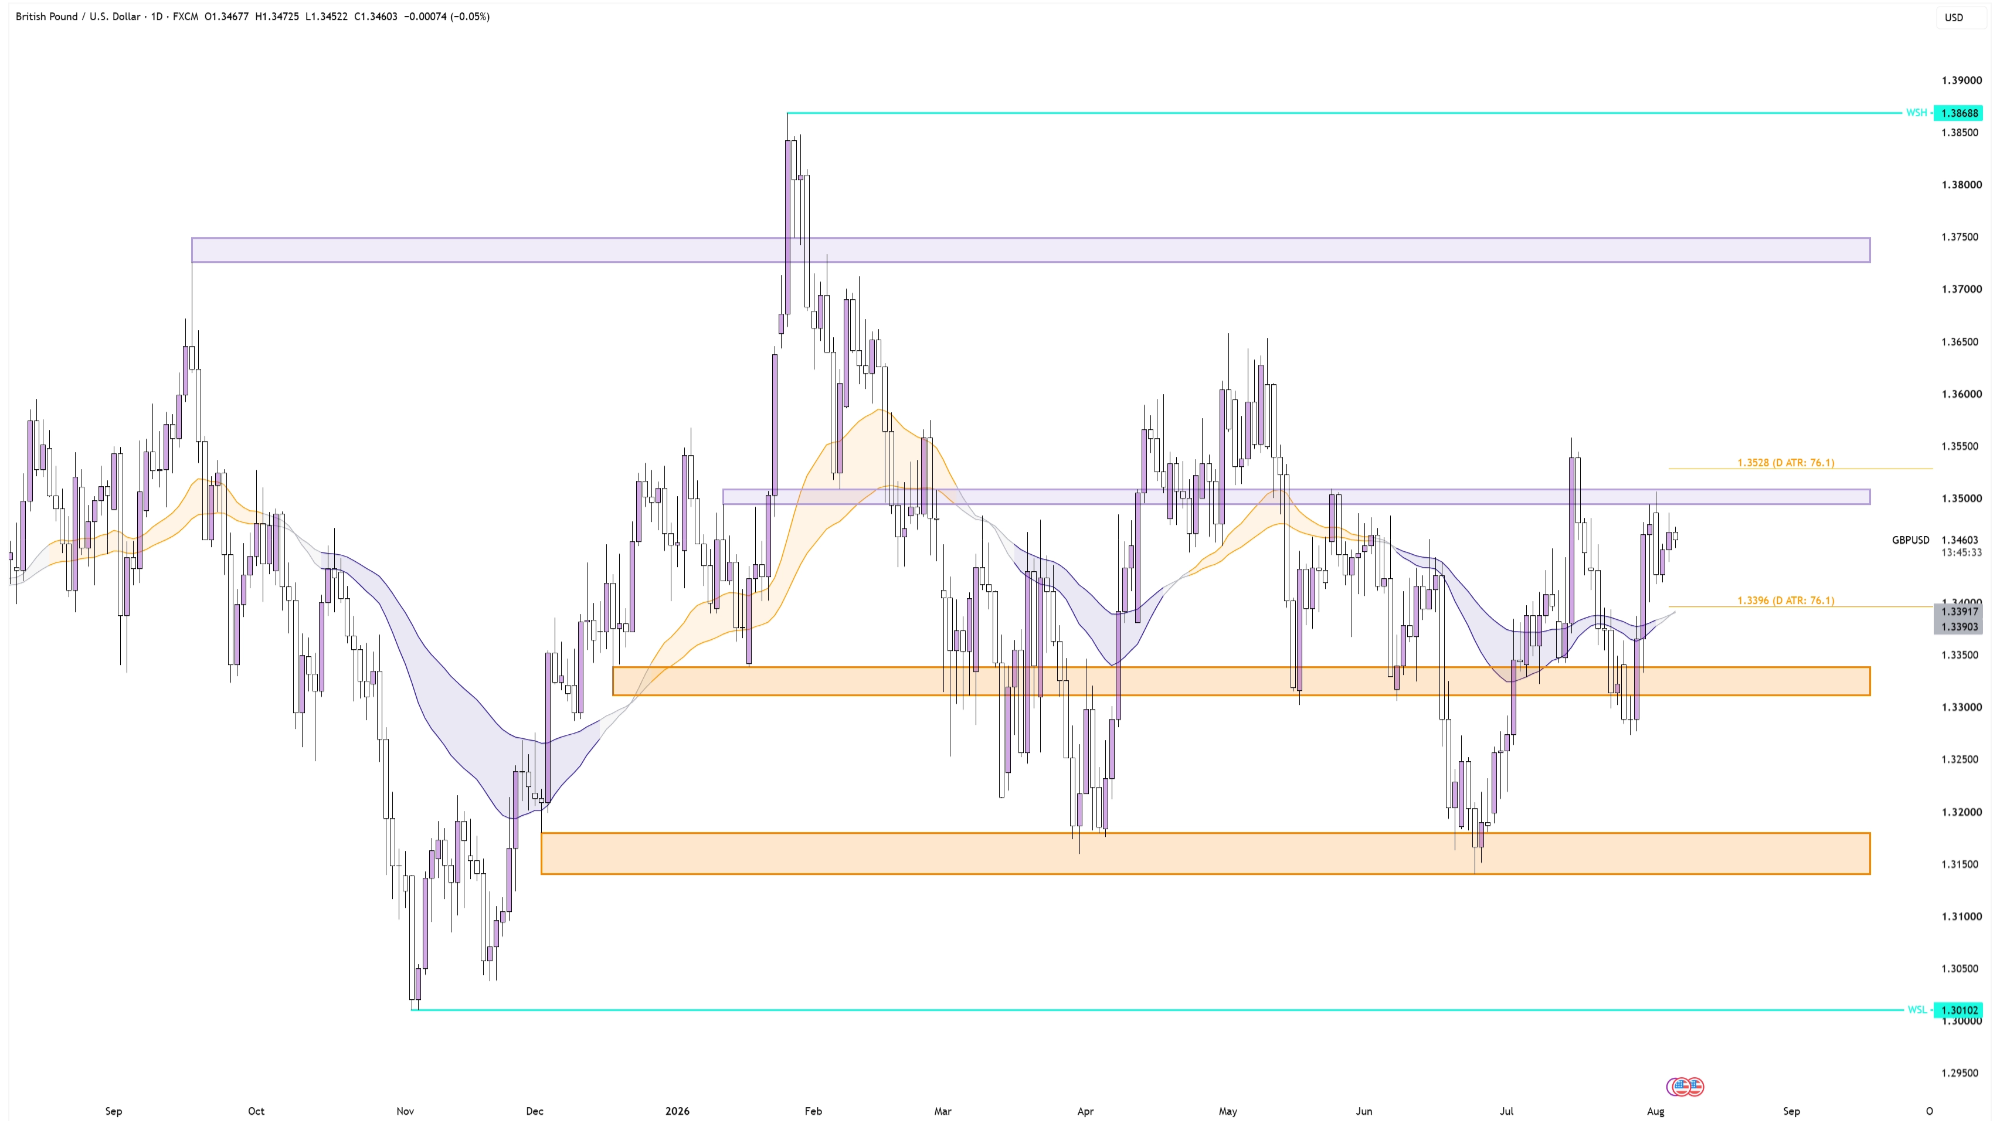
GBP/USD on a Daily Timeframe
However, nothing from the technicals is screaming at us that this pair wants to break out. Instead, it sits exactly at the midpoint of a very well-defined range, with plenty of strong support and resistance zones to either side, limiting any impulse moves.
In real-world market dynamics, a sudden breakout from a range like this often requires an unexpected catalyst. Potential macro drivers could include aggressive policy shifts such as a 50+ bps rate hike from the Fed, or a shift in the UK’s fiscal outlook affecting sovereign debt ratings. The nature of the event doesn’t matter. Nor can we anticipate it beforehand; the real point is that technically, this chart seems locked up, and the way that range-bound behaviour can be negated is through a grey- or black-swan event.
Looking back at the chart, these are the levels to be looking out for:
- Resistance: 1.350 and then 1.373
- Support: 1.333 and lower down at 1.317
These technical boundaries are likely to guide price behaviour in the near term. Monitoring how price reacts as resistance flips into support – or vice versa – is your early clue on where price might break out from this multi-month range.