Silver has long been out of the spotlight. Ever since its historic top in January, the asset has been dragged down by its bigger brother and is now just a sigh away from its earlier October highs at $54.5.
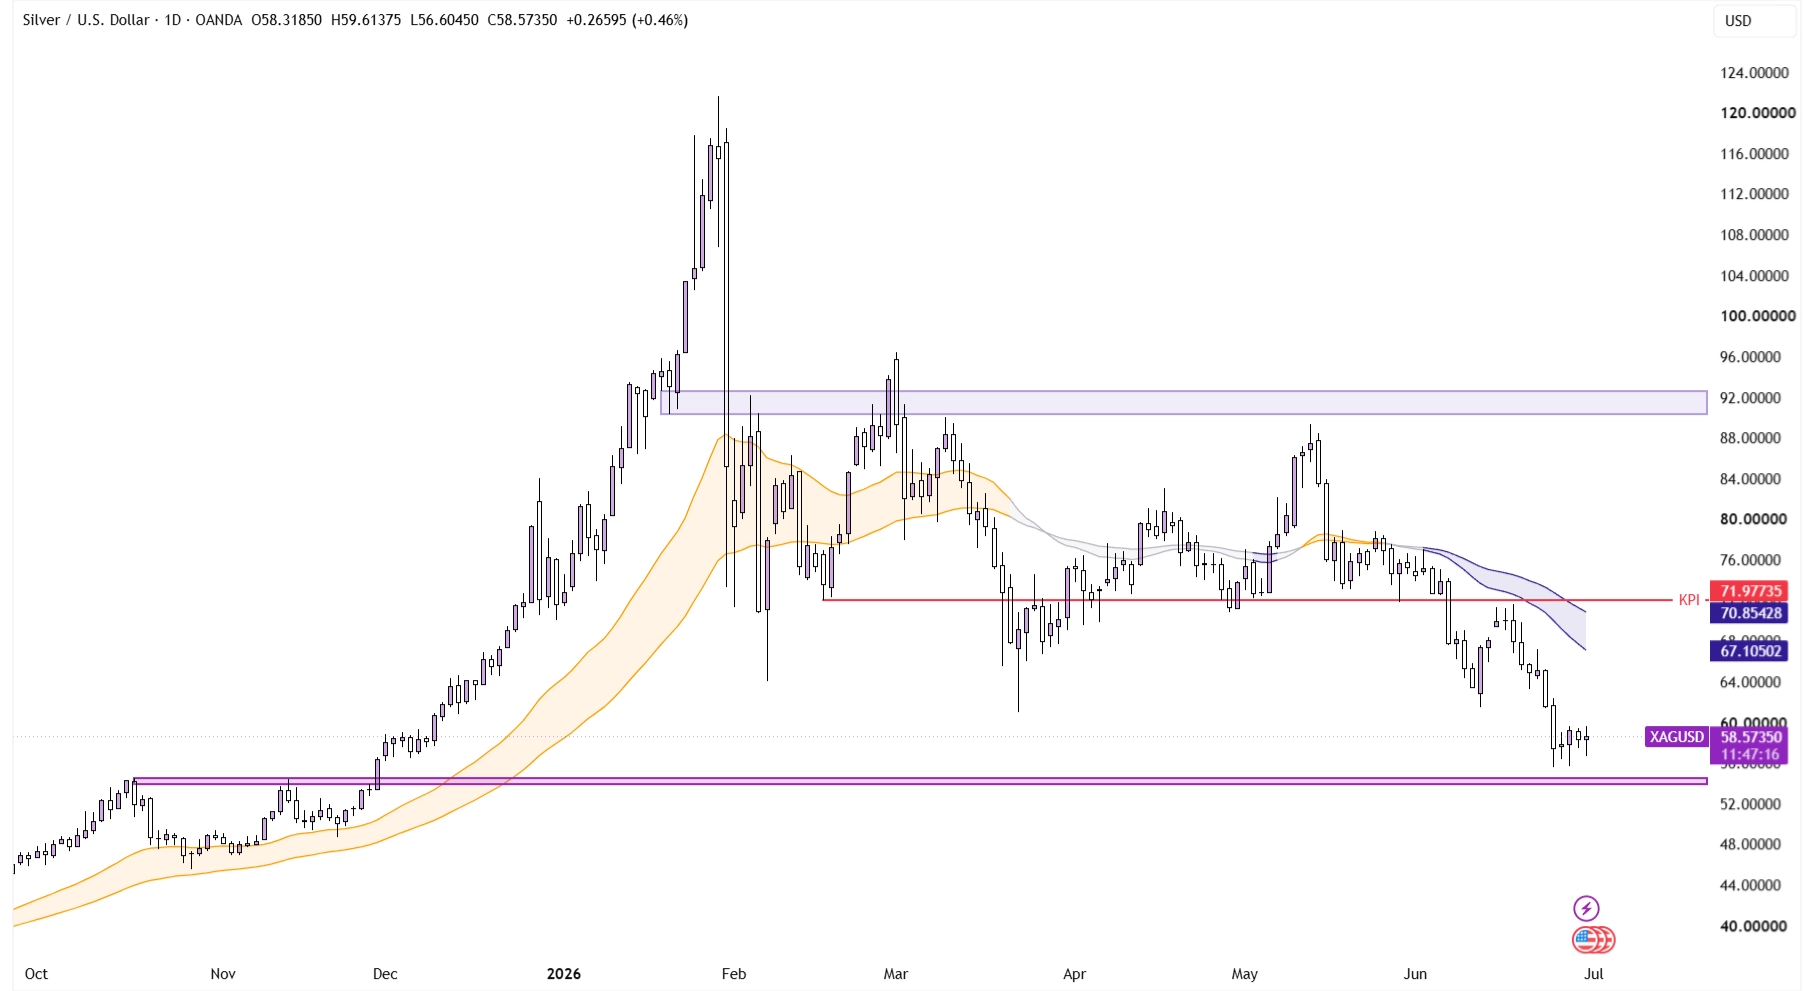
XAG/USD on the Daily Timeframe
However, it’s exactly at this point that the asset could find a local bottom. While we aren’t expecting any major bottom here, it is true that the asset has long been trending down without any extended bounce, and that this area of former highs shows a lot of technical promise.
As always, when looking at higher-timeframe charts, we need to keep the fundamentals in mind. Any major changes in silver mining or demand can easily circumvent any technical signs. All the chart can do is reflect the psychology of its participants, but it cannot predict the future.
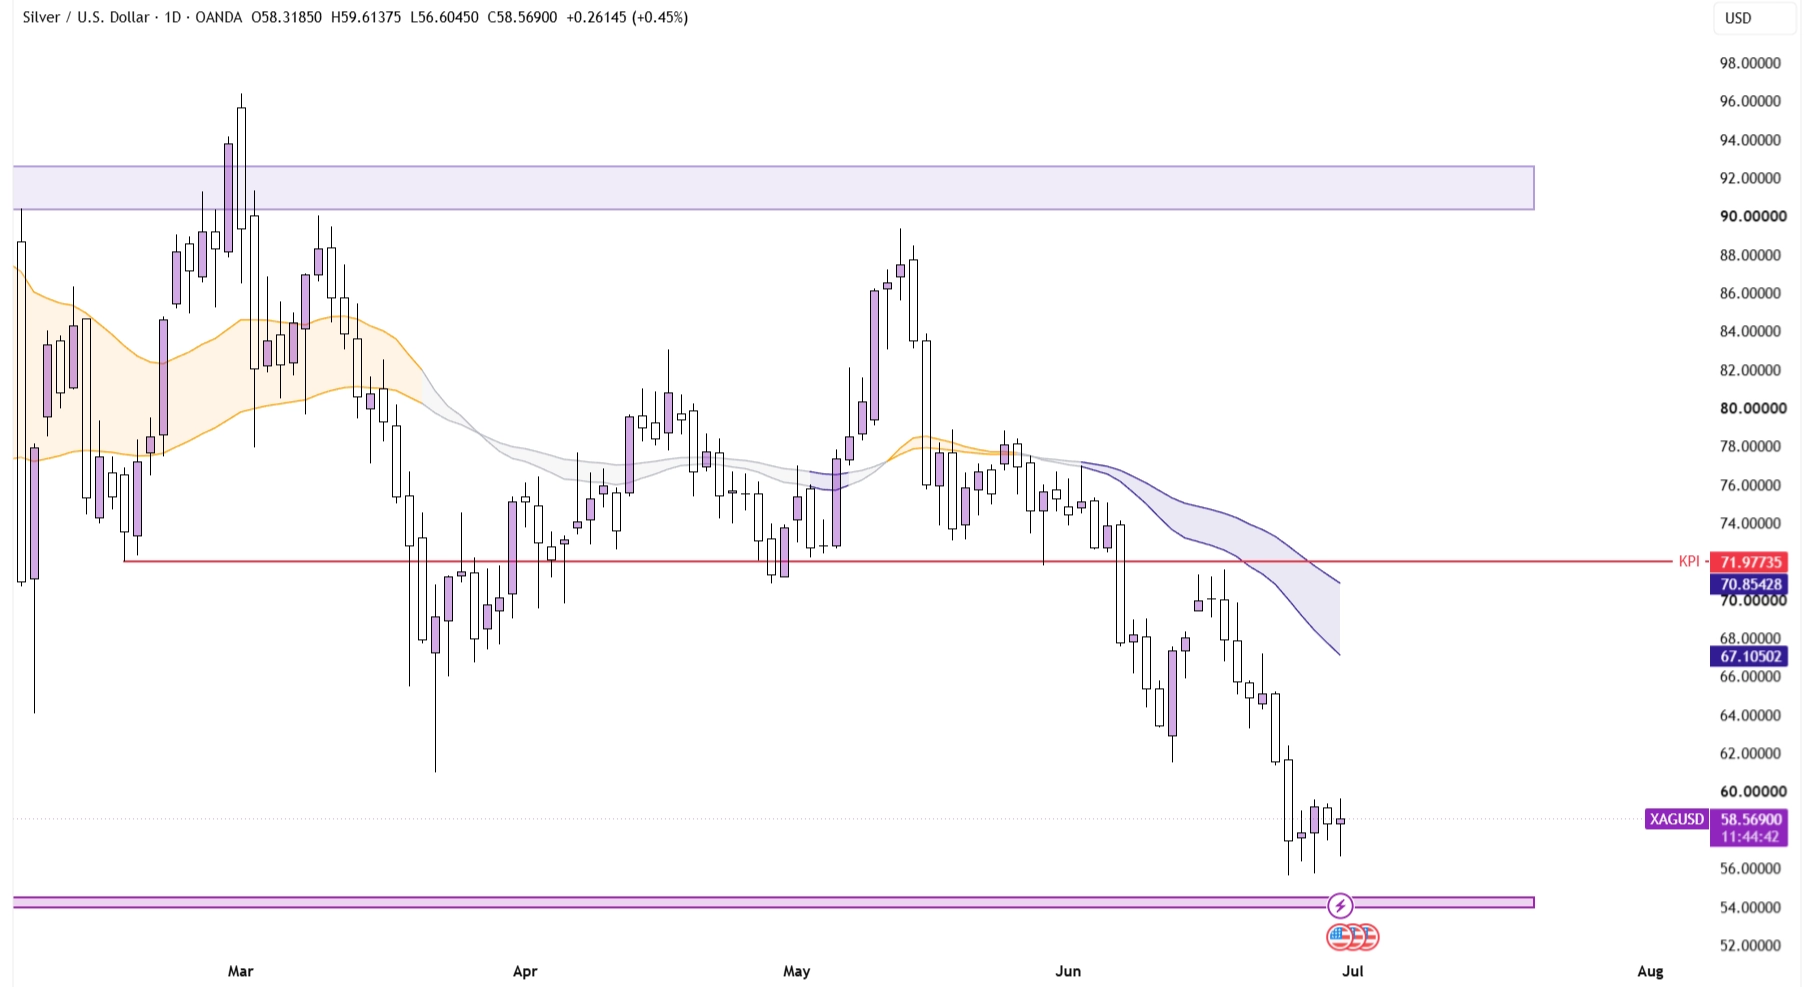
XAG/USD on the Daily Timeframe
However, it’s not impossible to imagine that price could establish a solid range here, with $54-$54.5 serving as the lower bound, the Key Point of Interest at $72 serving as a price magnet, and $90-92 functioning as upper resistance.