Introduction
Welcome to this week’s Market Pulse. We’ll be discussing the effects of the recent U.S. employment data on future interest rate policy, equity behavior across different indices, potential setups in GBP/USD, and the current outlook for Gold and Silver.
Global Macro
After last week’s flurry of central bank decisions, this week provided a much calmer macroeconomic schedule. This week’s focus was on U.S. unemployment data.
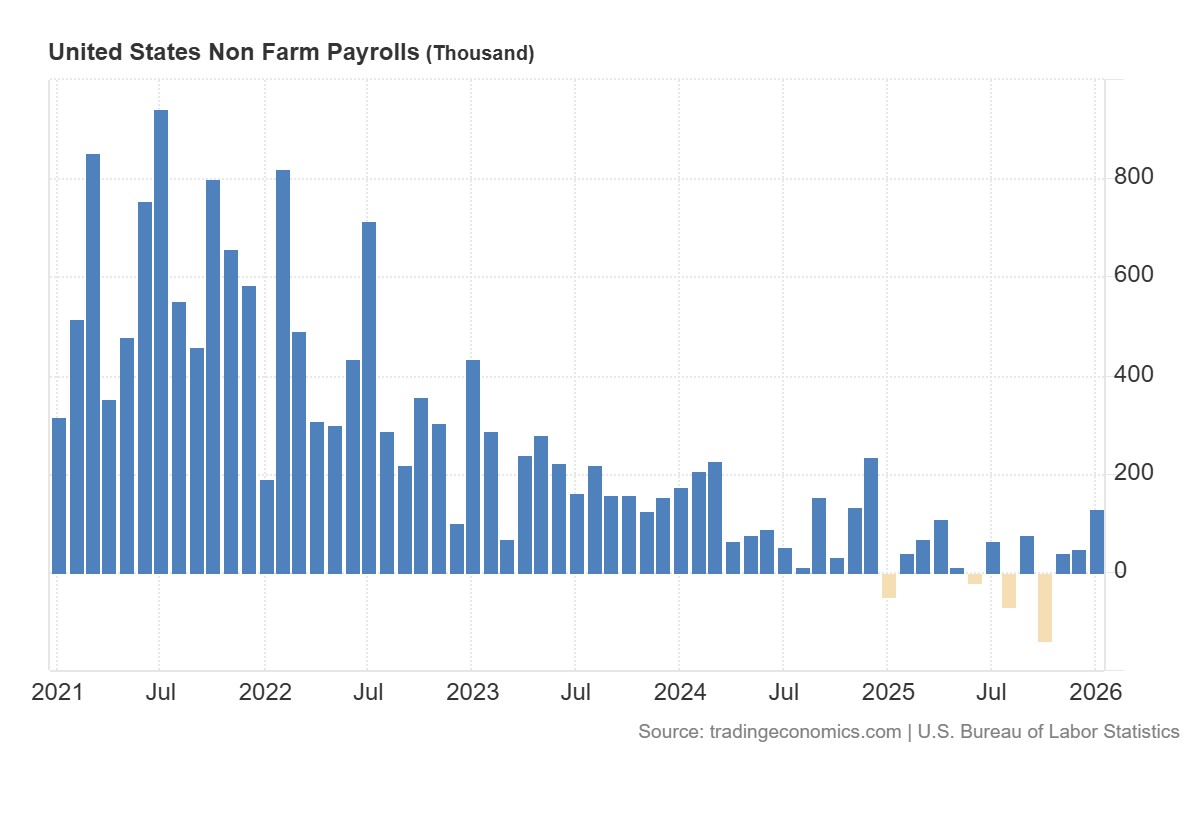
Non-Farm Payrolls came in stronger than expected at 130K, beating the 66K consensus. This helps to reverse the situation we have been seeing over the last few years, where job growth has been continually decreasing.
Strong employment data like this print is currently interpreted as bearish for risk-on assets since it doesn’t give the Fed any reason to cut rates. Rising NFP allows the Fed to wait out inflation and let it return to their 2% target without having to cut rates anytime soon.
Equities
This week saw a large spectrum of performances from all indices. While the S&P 500 and Nasdaq closed firmly lower, the Nikkei and EURO STOXX 50 pushed to new all-time highs. This current trend of U.S. underperformance has lasted for a couple of weeks, and it’s interesting to see how much longer it will continue.
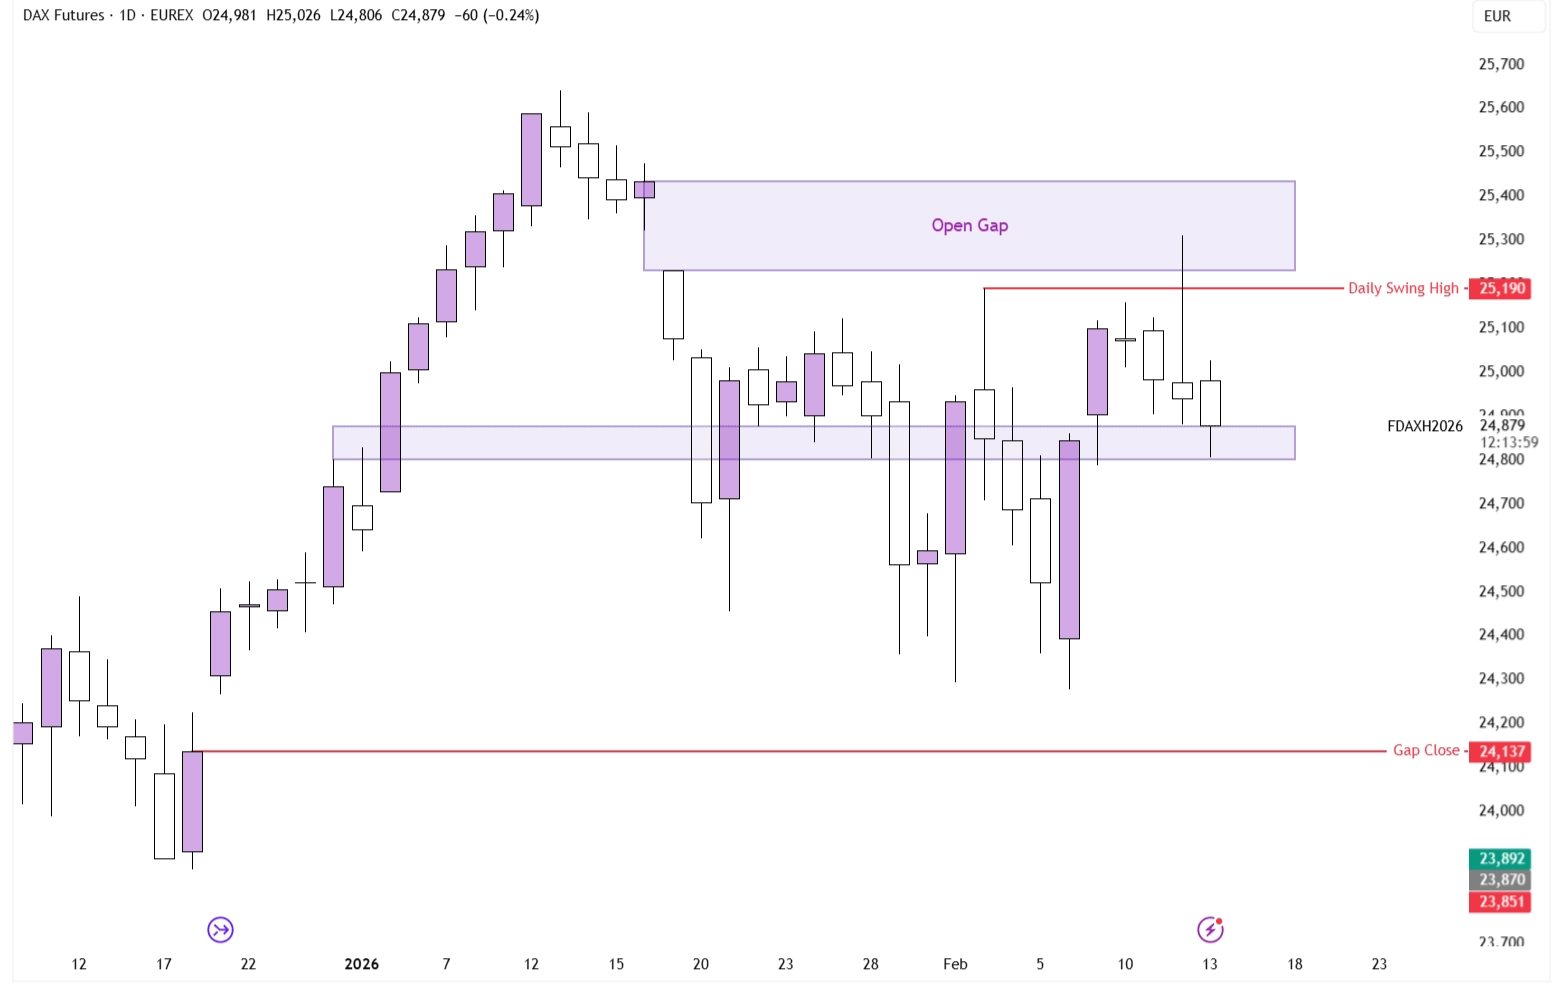
DAX on the Daily Timeframe
The Dax is showing a conflicting technical picture. On the one hand, price is right at a key support zone which was up until now untested from the upside, and is thus likely to provide support. On top of that, there’s a clear Open Gap not far above price, and the DAX generally closes its gaps sooner rather than later.
However, Thursday created a very bearish-looking candle. Not only did price put in a shooting star (small body, long upside wick with short downside wick), but it also swept the last Daily Swing High at €25,190, failing right at the open gap.
Because of this, price is caught between two strong levels: the €24,800-24,875 support area to the downside, and the Weekly Open Gap, which will only fully close at €25,434. With price caught between two strong levels, it puts us firmly in a wait-and-see environment when looking for a Higher-Timeframe bias.
Forex
The Dollar had a relatively calm week. Nonetheless, it doesn’t mean that there’s no interesting price action to observe. Most majors have been at multi-year highs against the Dollar, as relatively lower interest rates, geopolitical worries, and record fiscal deficits have put the Dollar’s safe-haven reputation under pressure.
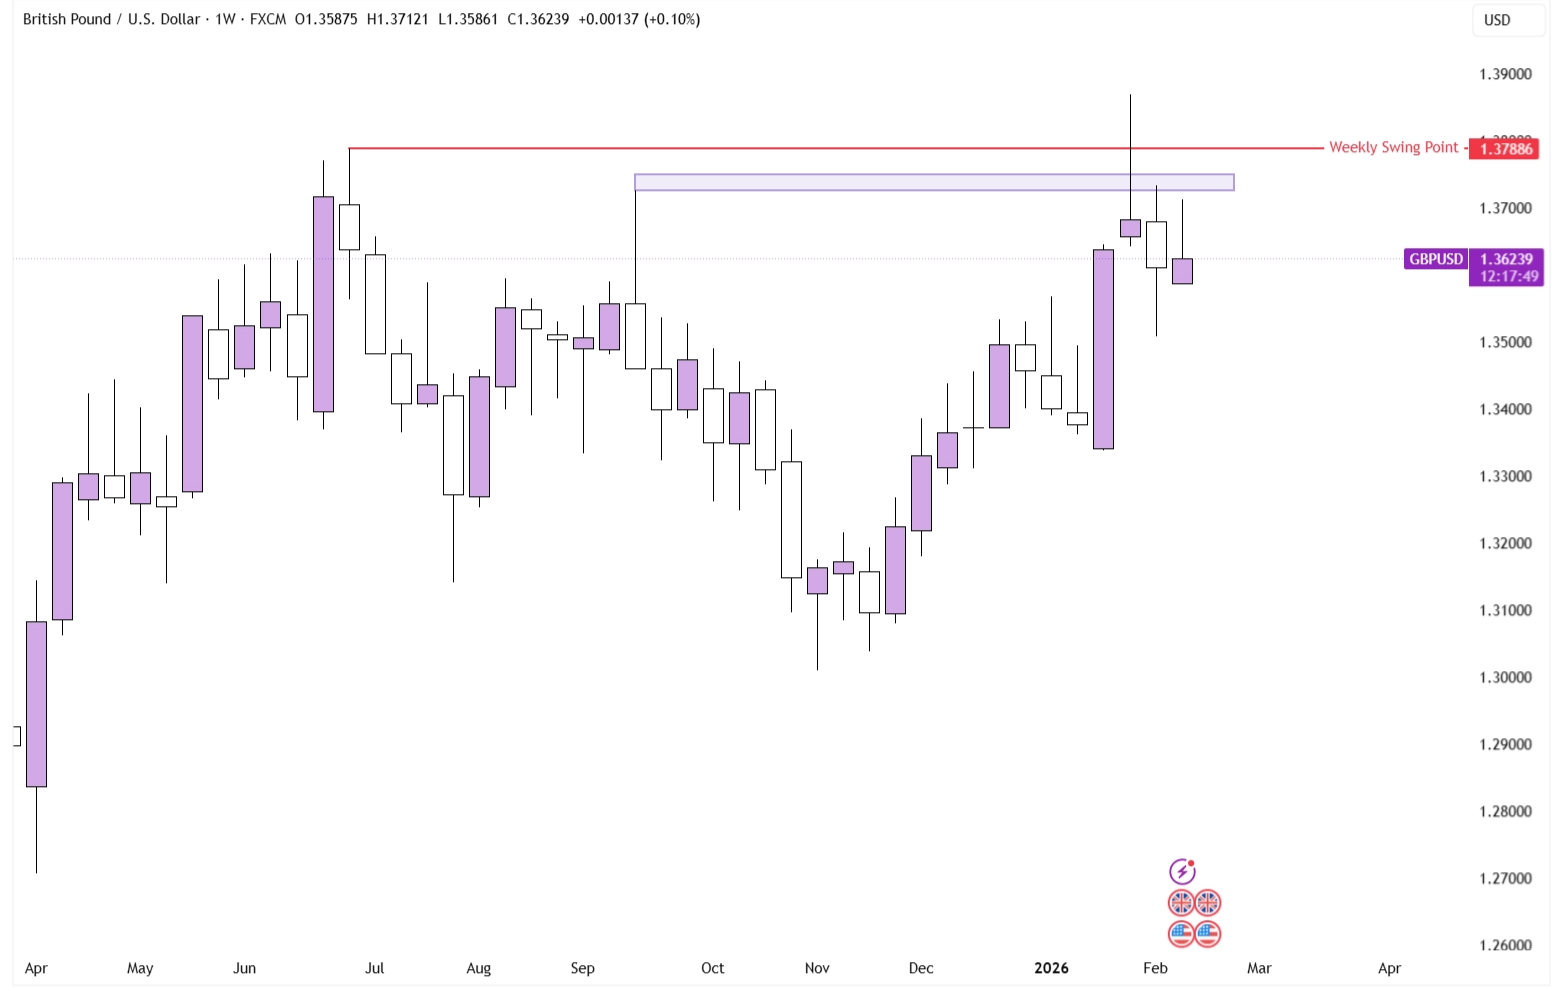
GBP/USD on the Weekly Timeframe
Lately, however, price action in GBP/USD and EUR/USD has shown signs that the Dollar bearishness may be at its peak. On the Weekly timeframe, both assets (although the picture is clearest in GBP/USD) show us a multi-month swing high dating from June 2025, which then got swept by a candle that is both a shooting star and a swing failure pattern during the last week of January 2026.
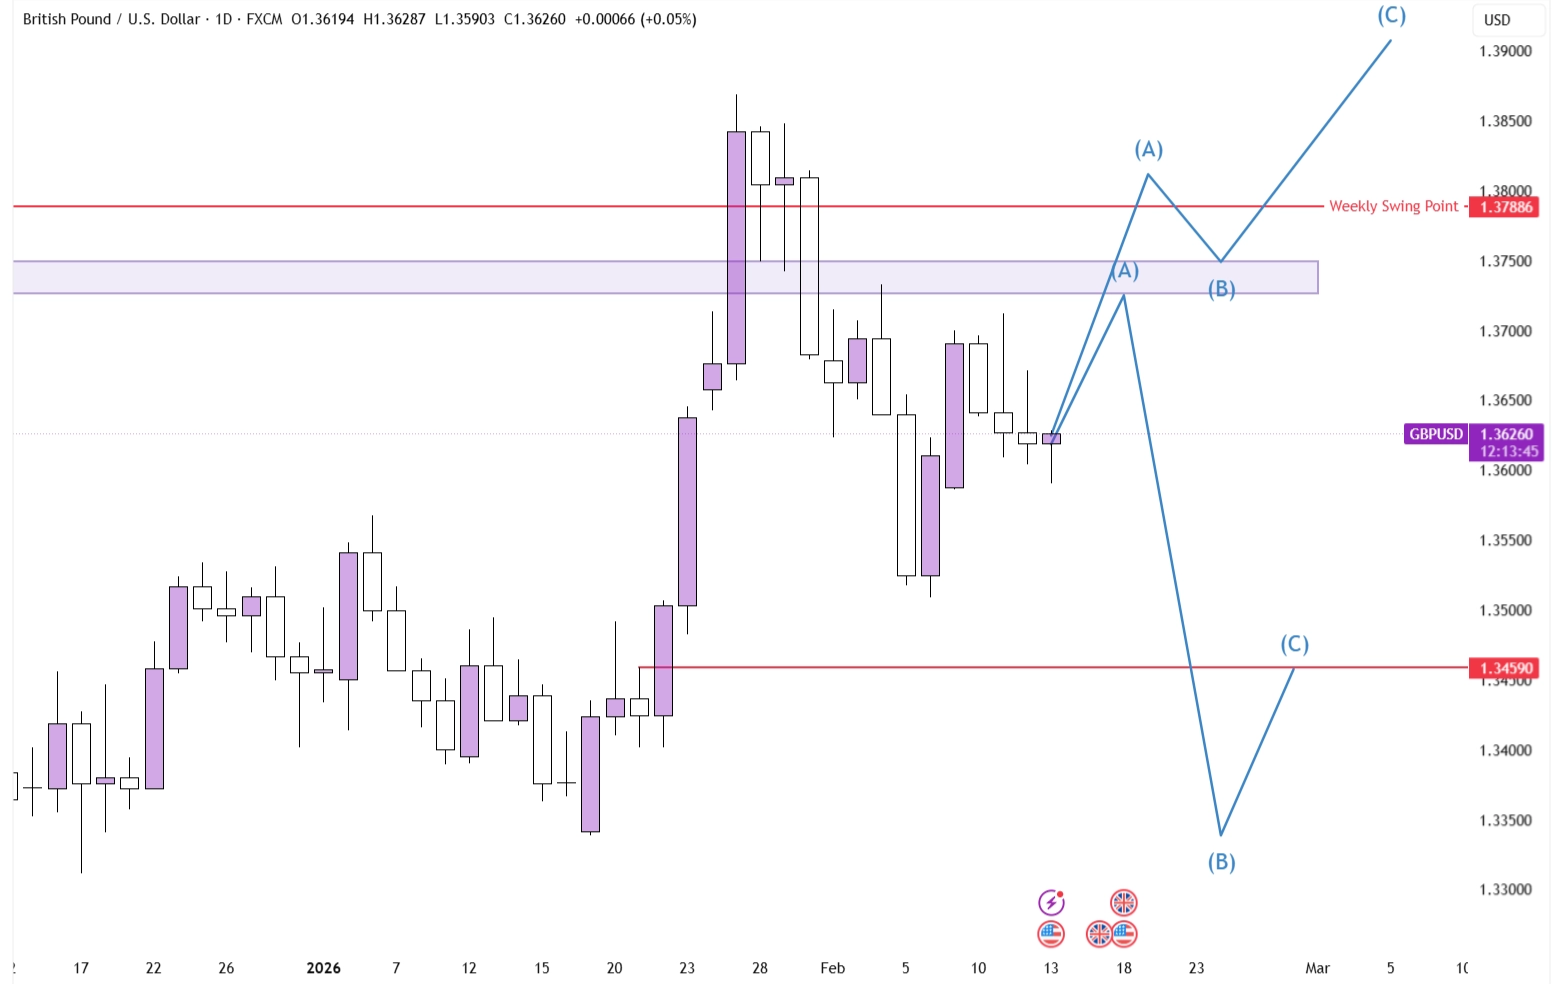
GBP/USD on the Daily Timeframe
This bearish weekly candlestick pattern is coexisting with relatively weak price action on the daily timeframe. From here, we see two major scenarios playing out.
- Price reaches the 1.373-1.375 resistance area, and it reacts from there nicely. Either price starts dumping immediately, or it consolidates a bit before macro-economic news pushes the pair back into its range
- Instead of reacting nicely to the 1.373-1.375 range, the price breaks through and, after spending some time above it, even manages to turn it into support. This, coupled with bearish USD macro-economic news, puts the Dollar under pressure again, with GBP/USD and EUR/USD surging to new multi-year highs.
The sidenote that you have to pay attention to here is that the fundamental backdrop is absolutely crucial. On a multi-day to multi-week timeframe, trading profitably is a case of combining technical and fundamental analysis; just looking at one is a dangerous game to play.
Especially the Dollar side of things should be watched with attention, as any breaking news can quickly invalidate a bullish or bearish looking chart.
Commodities
Both Gold and Silver have been trying to claw back their gains but have been relatively unsuccessful at doing so. At this point in time, the chart looks rather bearish for both of them. After a multi-year bull run that matches that of prior bottom-to-top returns, the charts of Gold and Silver look like a blow-off top.
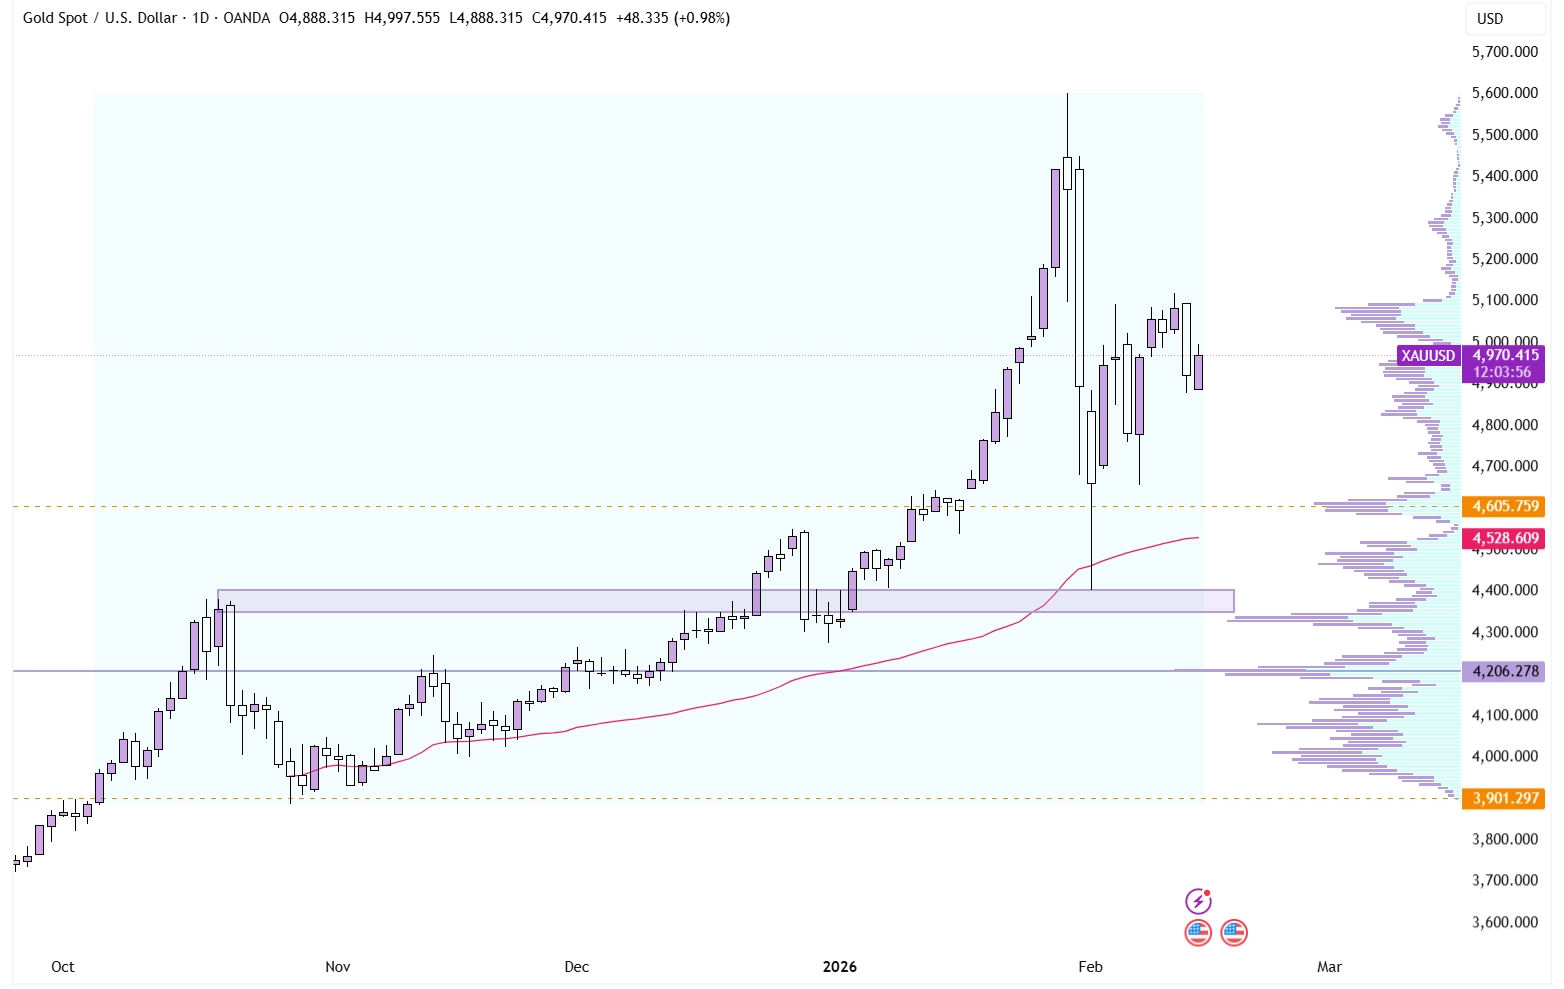
XAU/USD on the Daily Timeframe
However, the fundamental bull case for both assets persists. Silver is at multi-year inventory lows and has many industrial applications, mostly in the EV sector. Gold, on the other han,d profits from the continued diversification away from the Dollar, fueled by geopolitical tensions, high U.S. debts, and lower real interest rates.
With the fundamental and technical picture contradicting each other, the best position is often flat.
Conclusion
One-sentence summary of the week:
Strong NFP and bearish technicals build the case for a bullish USD, while American indices continue to underperform.