Introduction
It was another one of those weeks where the charts tell one story and the fundamentals tell another. Between a hawkish surprise in the FOMC minutes and the S&P 500 struggling to push to new All-Time Highs, there’s plenty to cover. Let’s get into the breakdown.
Global Macro
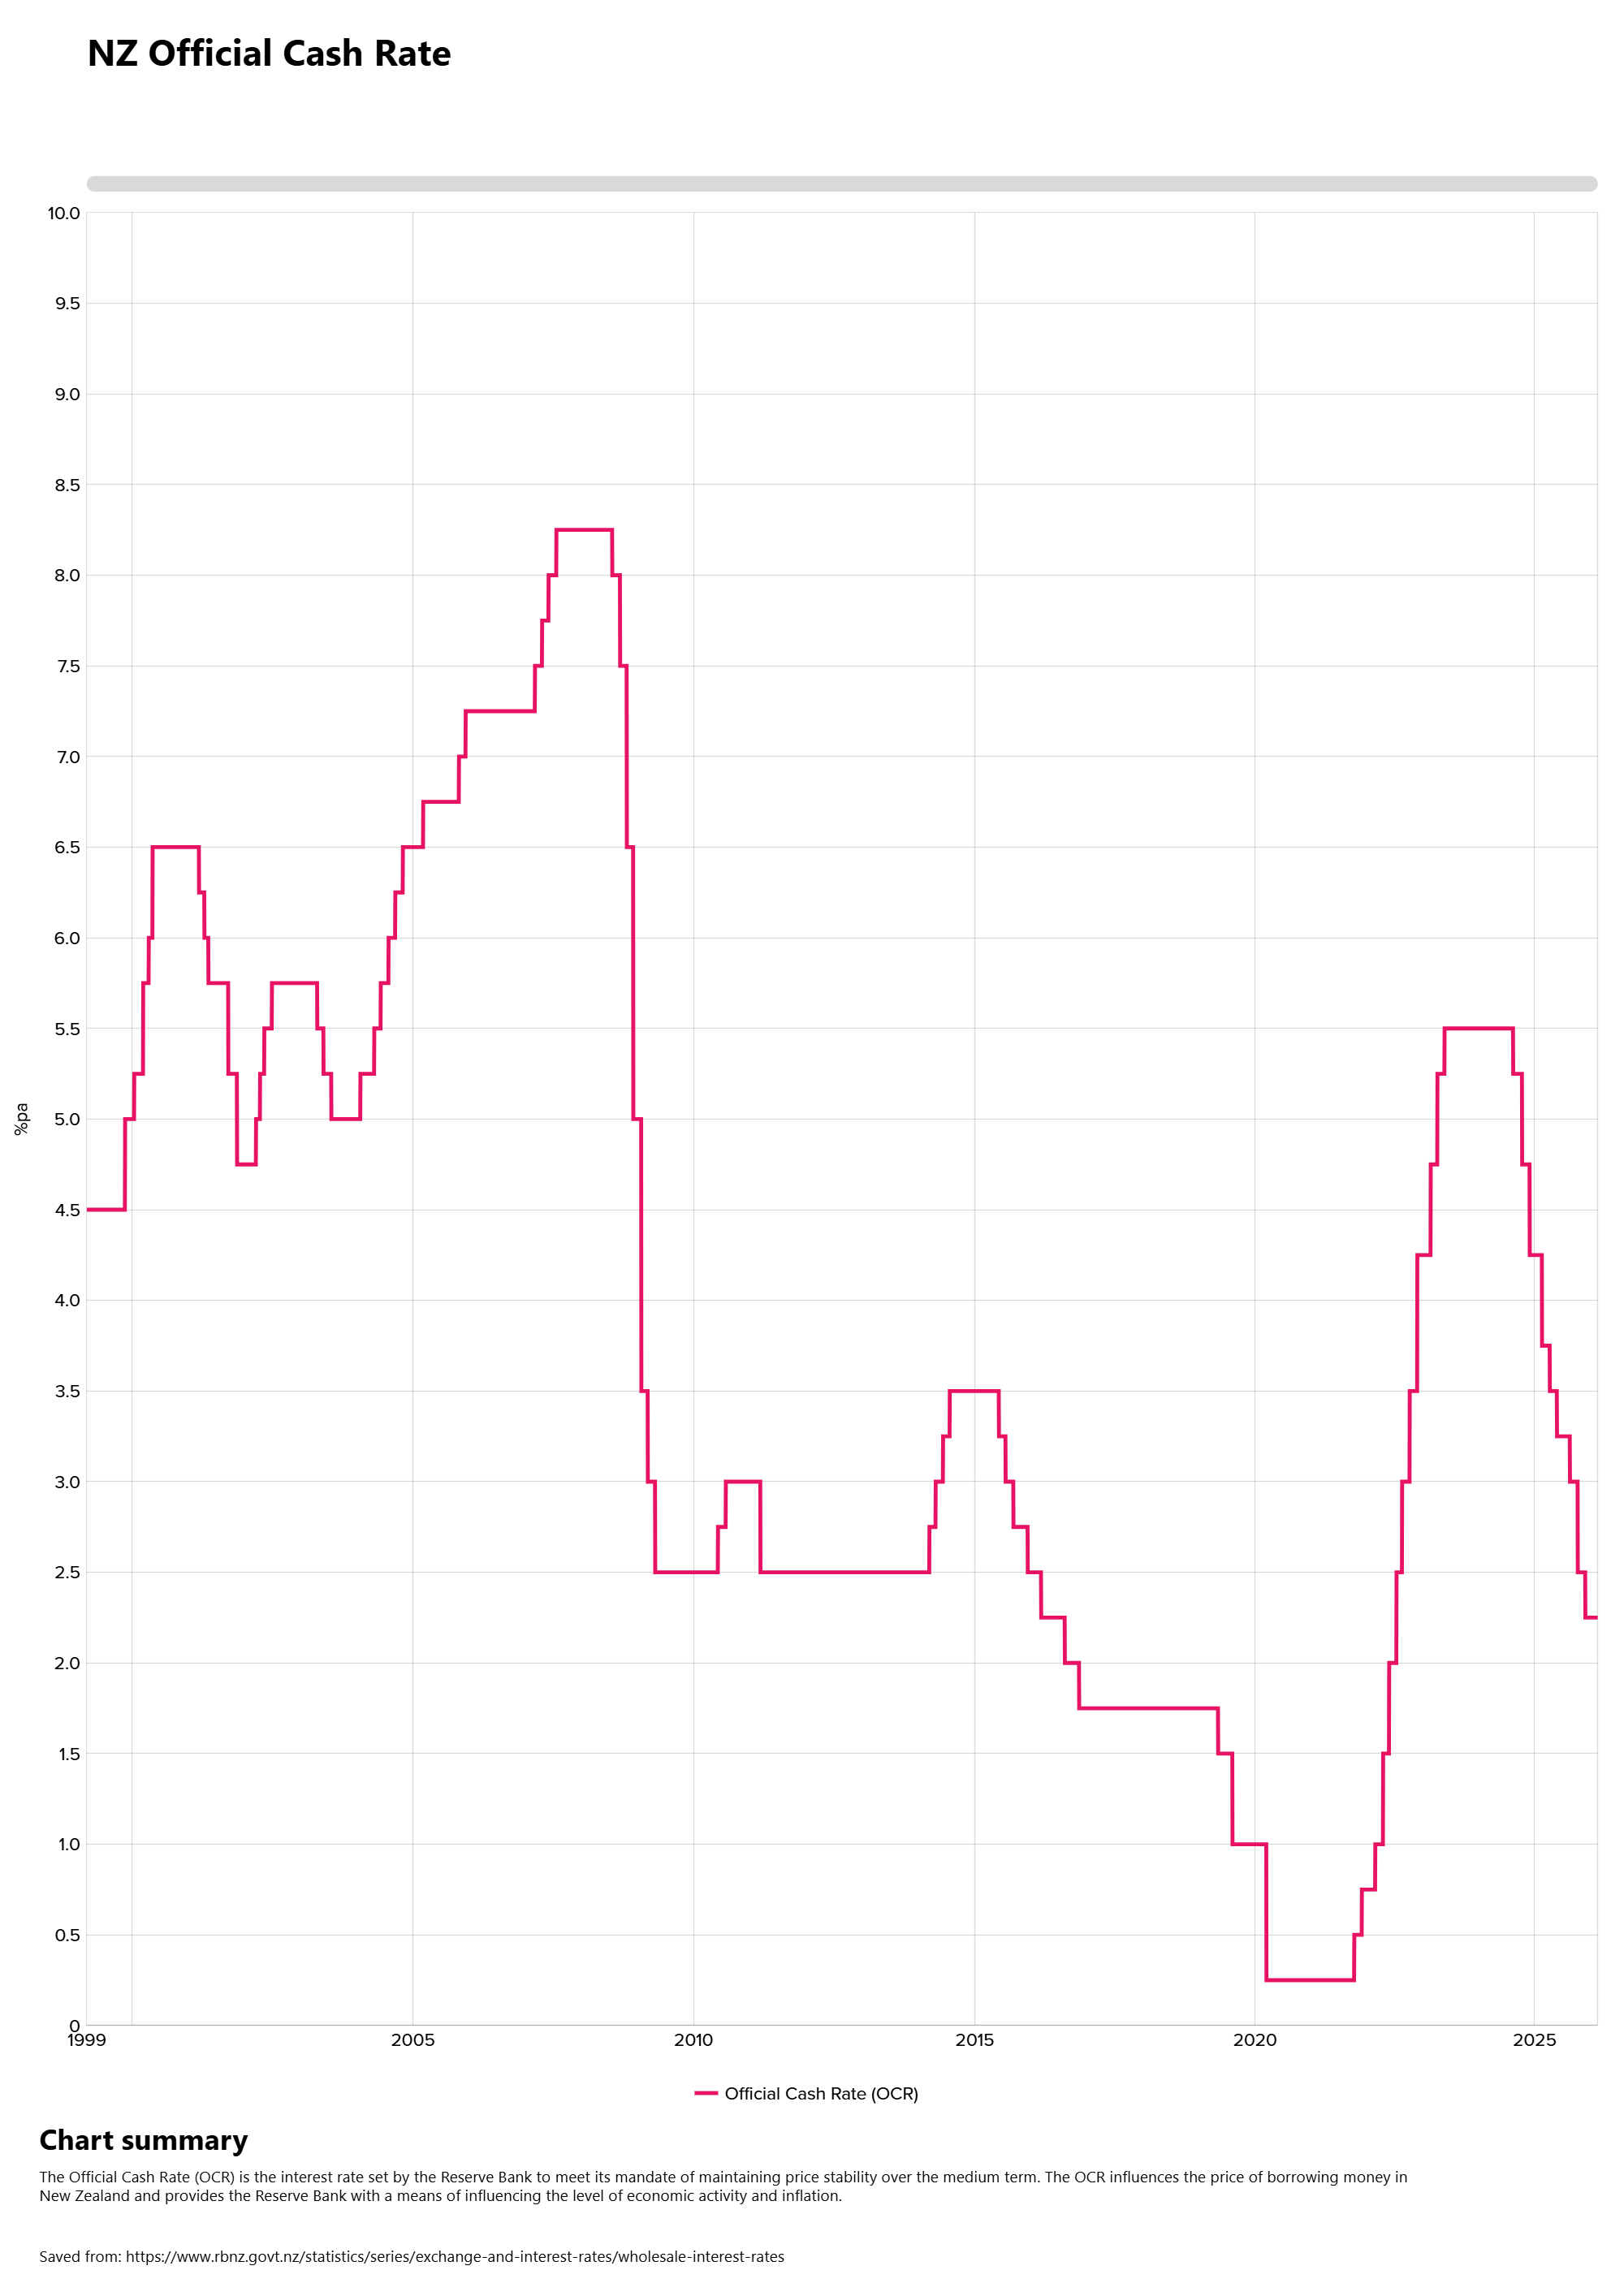
RBNZ Interest Rate Decision
This week, the focus was on the Reserve Bank of New Zealand (RBNZ). As broadly expected, they decided to keep rates stable at 2.25%, citing that they think they are in the right spot as unemployment and inflation are expected to come down, while better growth is also expected.
FOMC Meeting Minutes
While the actual FOMC meeting is now three weeks in the rearview mirror, this week’s release of the meeting minutes offered a deeper look into the internal debates. Interestingly, the minutes painted a more hawkish picture than the initial press conference suggested.
Talk of potential rate hikes has officially rejoined the conversation, with several participants noting they remain open to further tightening if inflation proves stubborn. Since the market is currently pricing in two rate cuts for 2026, a rate hike would be quite the upset for risk-on markets.
However, the minutes also showed us that the majority of the members believe that the current pick-up in inflation is due to tariff effects in goods, and that these effects will pass through by mid 2026. If true, it will naturally bring the possibility of rate hikes to a halt and instead open the door to lower interest rates.
Equities
Except for the Nikkei, all major equity indices were up this week, with the Euro Stoxx and Dax again putting in the best performance. The S&P 500 has been ranging for a couple of weeks, unable to put in new ATHs.
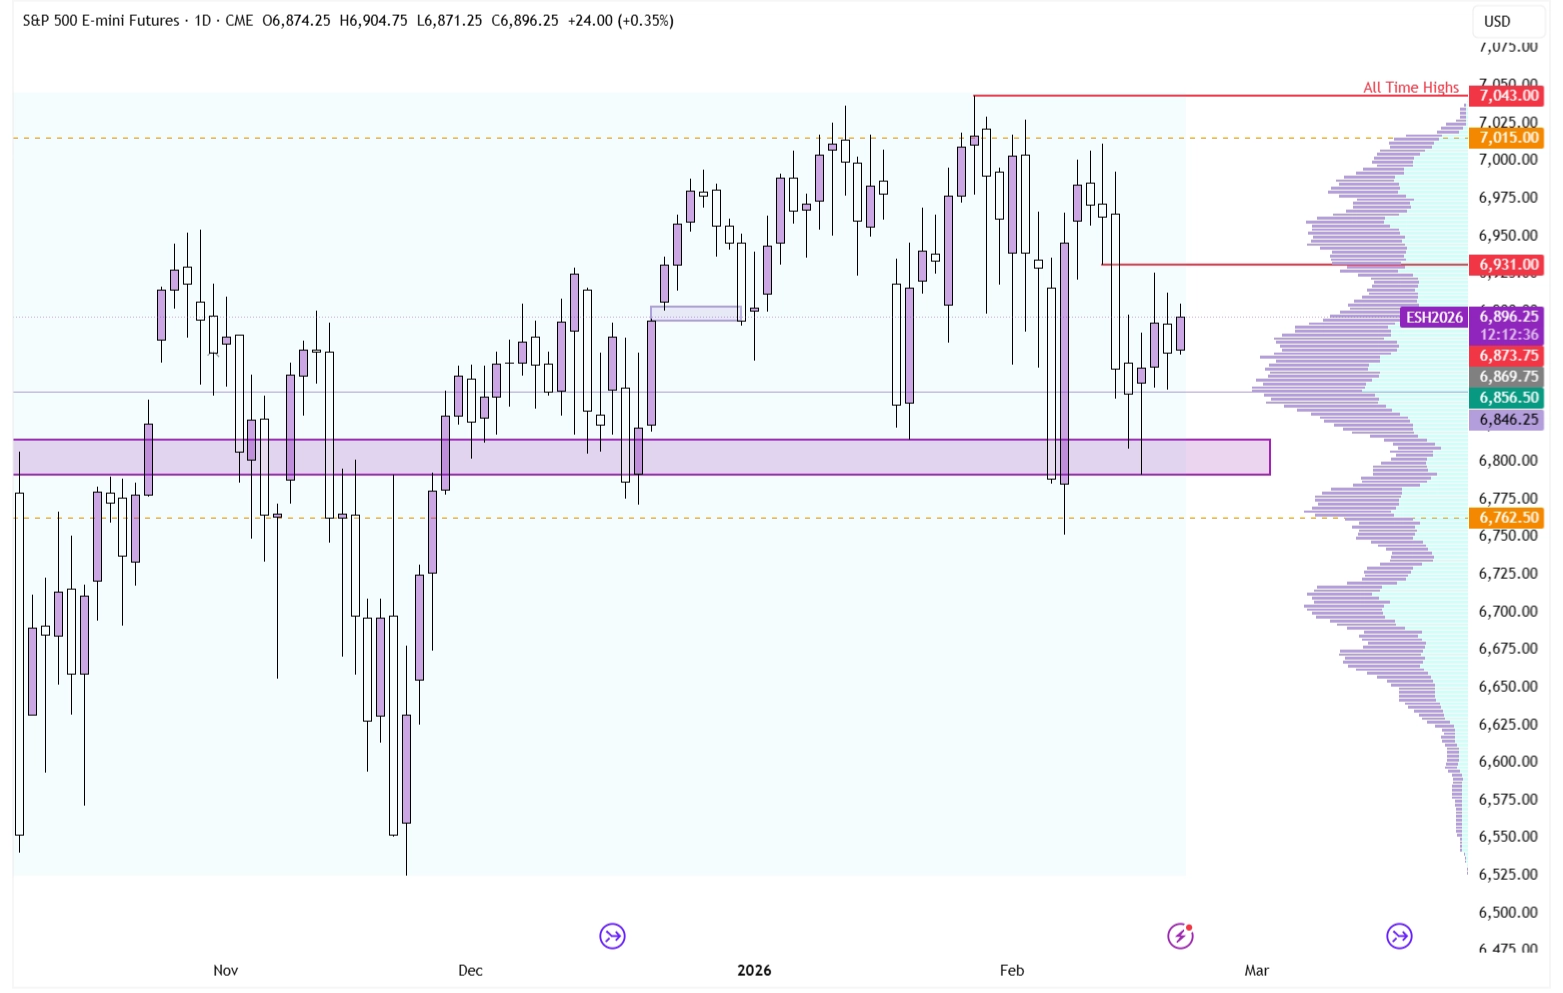
S&P 500 on the Daily Timeframe
The current technical picture is rather balanced, as the price seems stuck for now between two levels. On the upside, there’s the $6,911 level, which seems likely to give at least a short-term bounce. On the downside, we have the $6,790-6,815 range, which has been very accurate so far this range, but after five different touches from the upside, with each touch creating a smaller bounce, it seems like the level has significantly weakened. It thus wouldn’t be surprising to see price roll over and break through this support area if it were to test it again in the coming one to two weeks.
Furthermore, price is creating a Head & Shoulders pattern. While these patterns aren’t very reliable, other market participants do see them and, barring any negative economic developments or risk-off environment, might make a deeper correction more likely.
In short, the S&P is stuck between two levels with a very slight bearish bias on the Daily timeframe.
Forex
In last week’s edition, we discussed how GBP/USD was showing a rather bearish picture as the Sell-Dollar narrative might be reaching its peak. That bias has played out rather well this week, with GBP/USD being down every single day so far (Friday close has not been reached as of writing this).
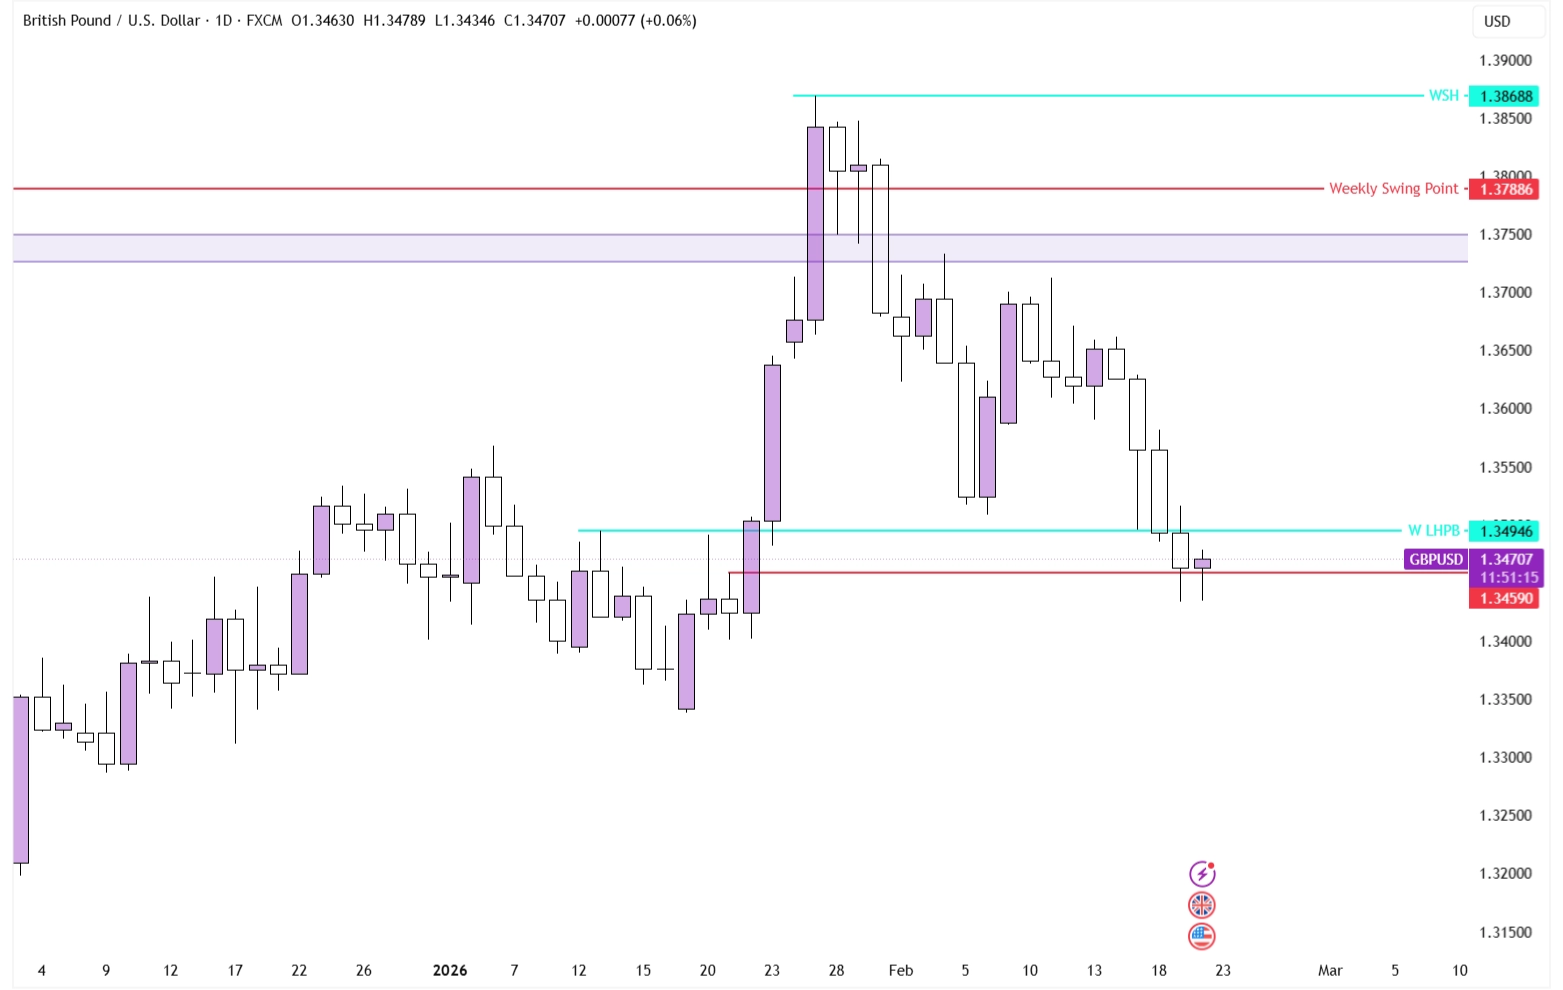
GBP/USD on the Daily Timeframe
While our earlier bias has played out well, the current chart is not giving us any hints as to where the price might go next. The most logical outcome from here is a couple of days of compression, especially as next week’s macroeconomic calendar is devoid of any major news events.
Commodities
Gold and Silver have seen another balanced week. It seems like the extreme volatility that we saw coming into the January 29th peak has disappeared, at least for now.
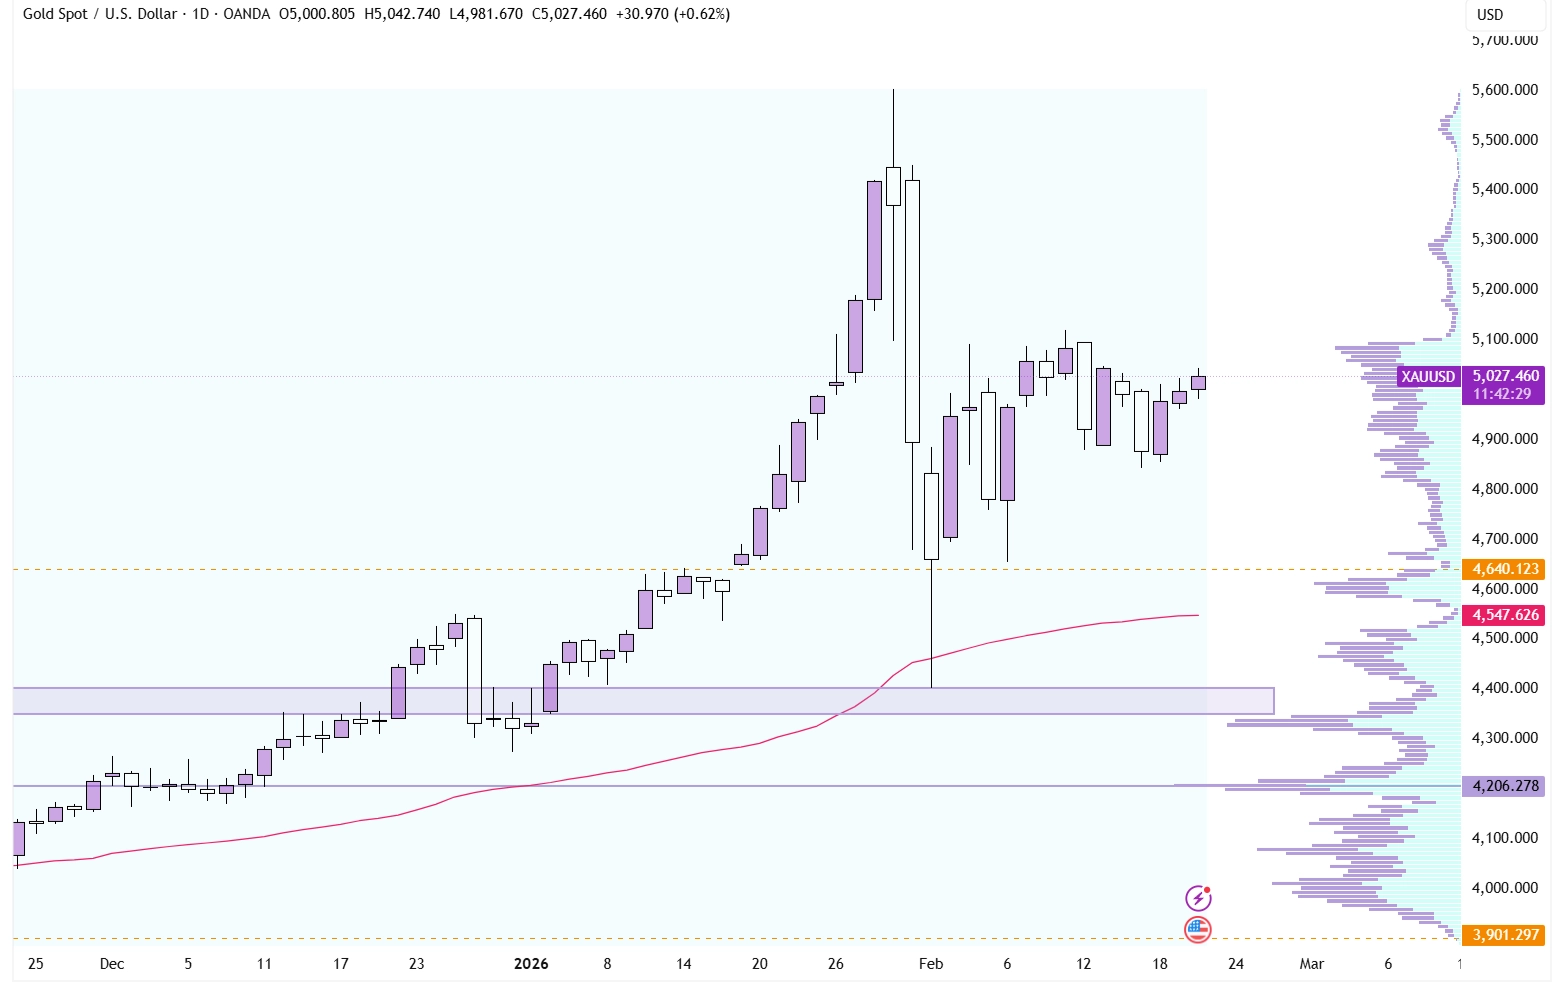
XAU/USD on the Daily Timeframe
Current price action in Gold & Silver brings to mind the old trading adage: "Staircase up, elevator down." This is where price slowly but consistently grinds up over an extended amount of time, only to have those gains completely erased by one down candle.
Right now, both Gold and Silver are proving tough to get a good read on. While volatility has temporarily subdued, it’s unlikely to stay that way. Gold rarely triples in value over three years without a significant correction. So either this is just a consolidation before the next leg up, or it’s the start of a larger move down.
Conclusion
One-sentence summary of the week:
NZD/USD drops as RBNZ pauses, S&P 500 is slightly bearish, and Gold is seemingly in staircase up, elevator down mode.