Introduction
Following the two-week ceasefire agreement in the Middle East, markets have begun to price out the "worst-case" energy disruption scenarios. Aided by relatively lower inflation data, this week saw a return to a risk-on environment, as stocks rallied and the Dollar sold off.
Global Macro
The macroeconomic tape was unusually quiet this week, with the US PPI being the only notable event.
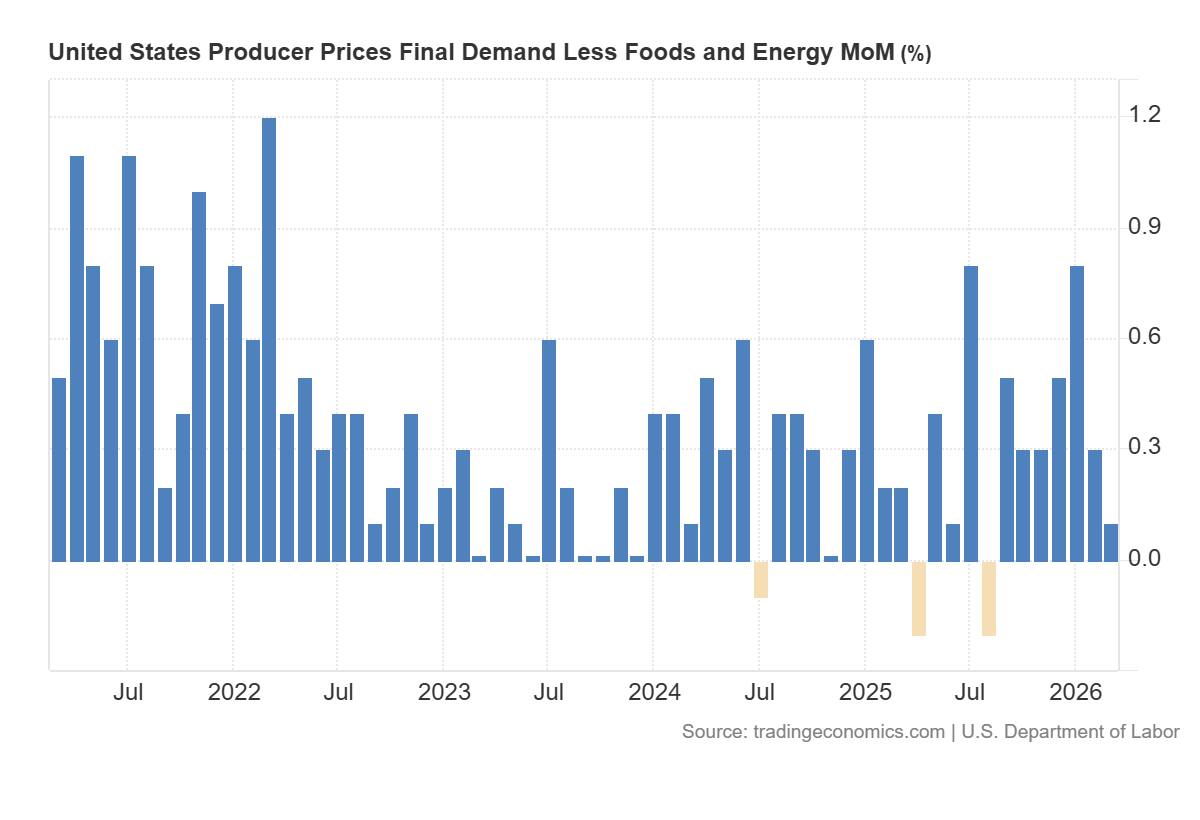
Core PPI (doesn’t account for energy & food prices), surprised to the downside, coming in at just 0.1% month-over-month compared to the forecasted 0.4% number. Although this data specifically excludes energy prices and is thus not quite relevant for the whole population, it does provide a bullish factor for markets.
Markets are expecting the surge in energy prices to come up in next month’s data, but with this month’s inflation being lower than expected, it means there’s a larger buffer to absorb this expected uptick in inflation. This, by extension, lowers the odds that the Fed will have to hike rates, which is thus a bullish force on indices and a bearish force on the Dollar.
Equities
This week’s eyecatcher was, by an order of magnitude, the aggressive move up in equities. Just last week, we were discussing how price had flipped our higher S/R area from resistance into support and seemed likely to retest it and hold.
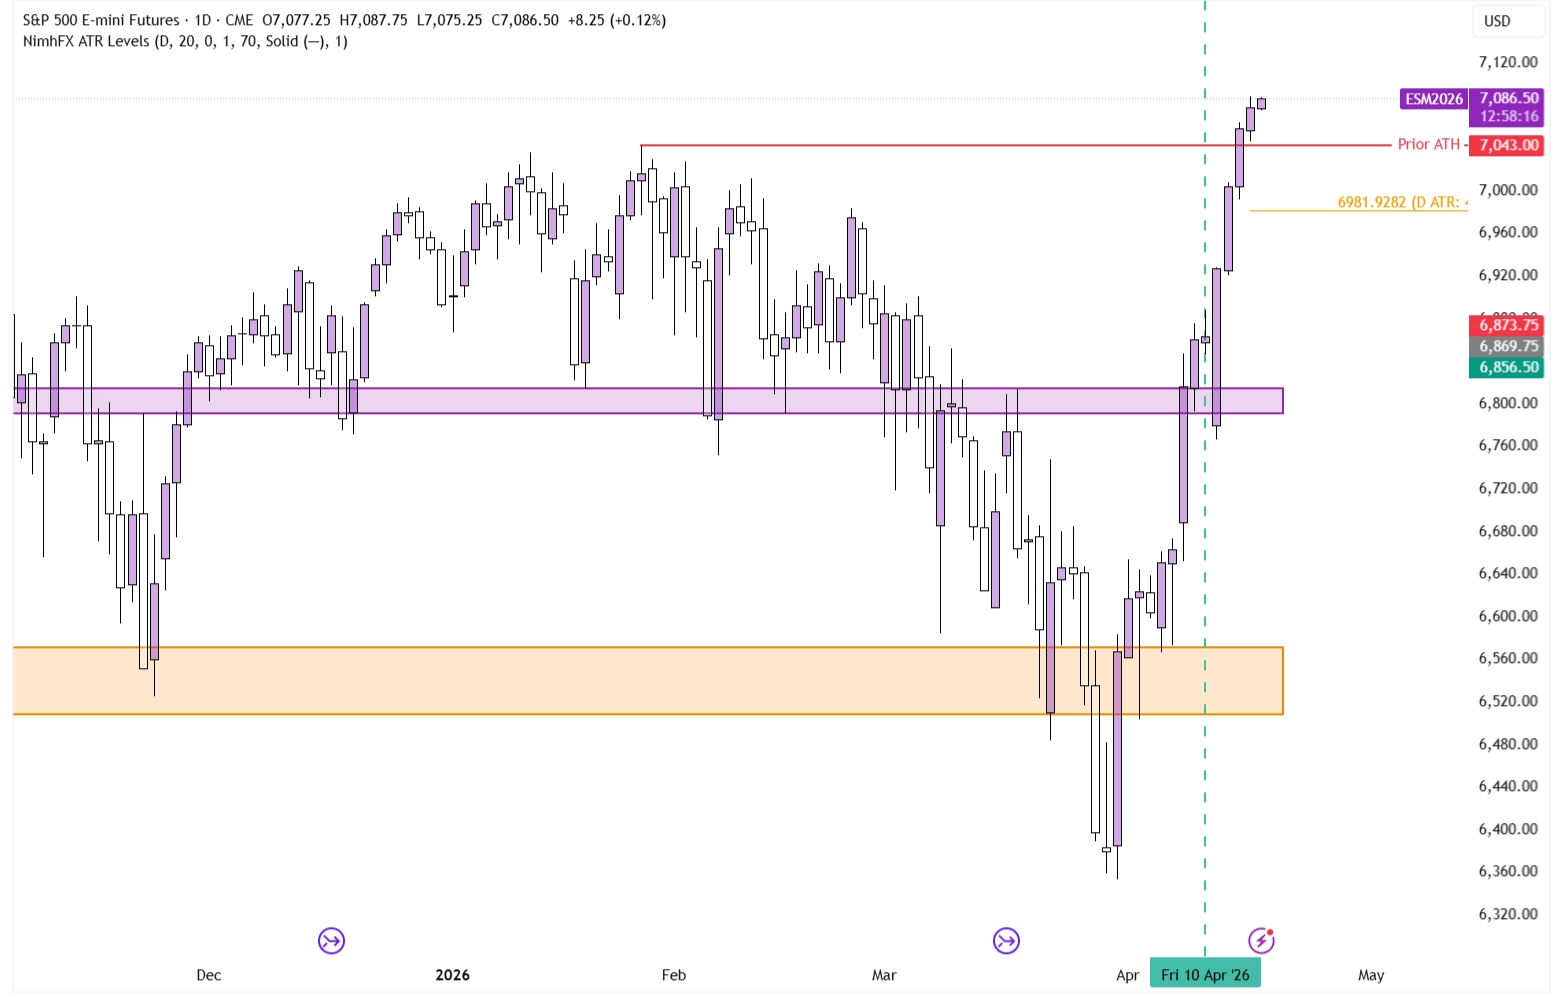
S&P 500 on the Daily Timeframe
However, what we didn’t expect was that price would test our support area early Monday morning, and then rally from there straight to All Time Highs, with basically no pullbacks. With prices now being back at ATHs, the wise thing to do is to assume the trend is up until proven otherwise.
Forex
As discussed in the macro section of this week’s Market Pulse, a significantly lower-than-expected PPI is a bearish force on the Dollar. Last week, we discussed both the EUR/USD pair and the S&P 500, noting that both had a very similar technical picture and looked set to hold their newly flipped resistance area into support, provided Friday’s close would leave the levels untouched (as time signals acceptance).
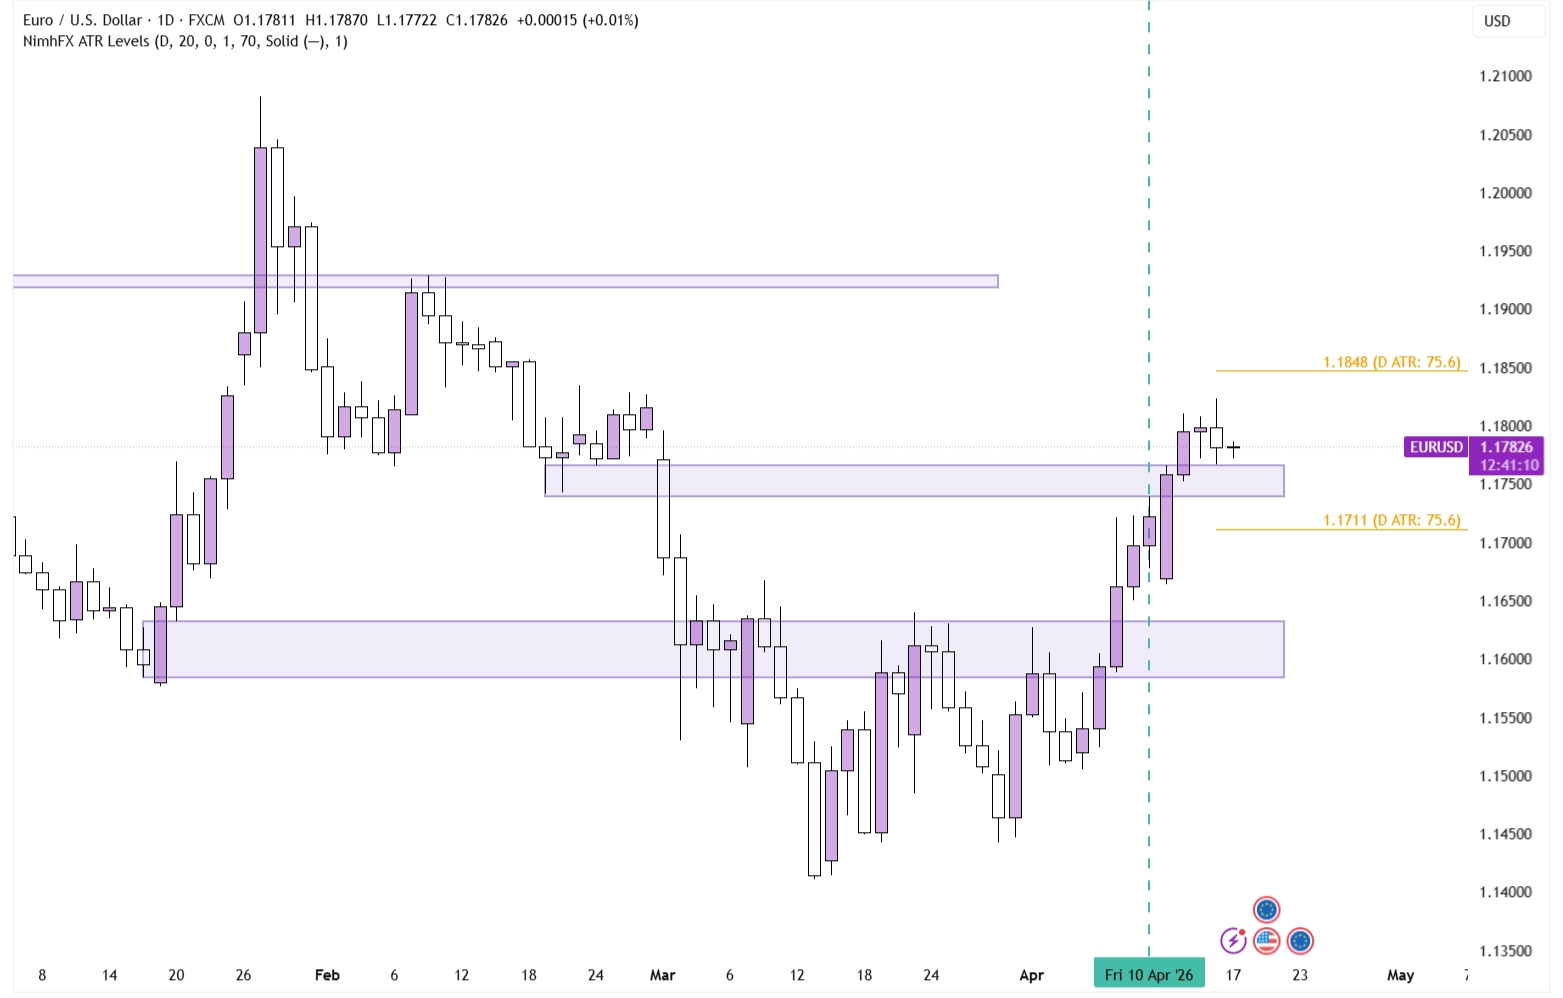
EUR/USD on the Daily Timeframe
In fact, price didn’t even require a touch of the 1.158-1.163 support level, and instead rallied straight through the next resistance level, helped by the US PPI, which was bearish for the Dollar.
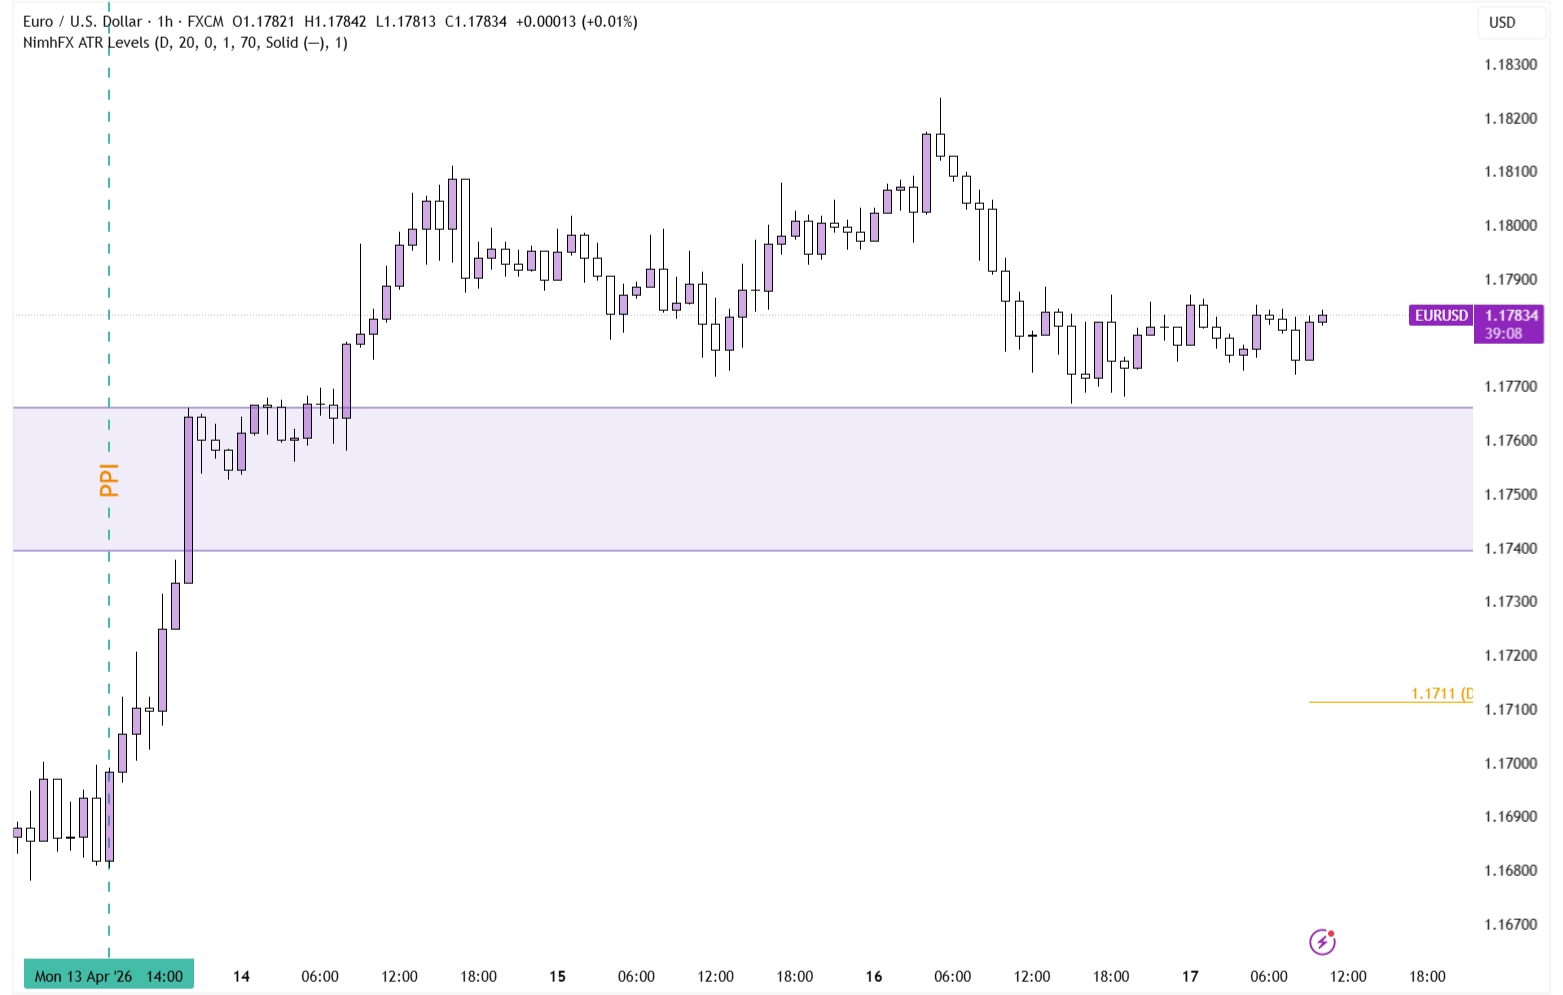
EUR/USD on the 1-hour Timeframe
Because of this, we are in a very similar situation as last week: price has broken through a prior resistance level but has not yet retested and held it successfully from the upside. So far, this price action looks conducive for further upward price action.
Price has a solid support level right underneath current prices, with no immediate resistance to the upside.
Commodities
With the eyes continually fixed on Oil as the conflict in the Middle East persists, we also return to Oil to determine if our view has changed. Last week, the Oil chart remained neutral. Prices were locked in a symmetrical range with an equal number of tests on both boundaries and a lack of clear candlestick patterns to signal a direction.
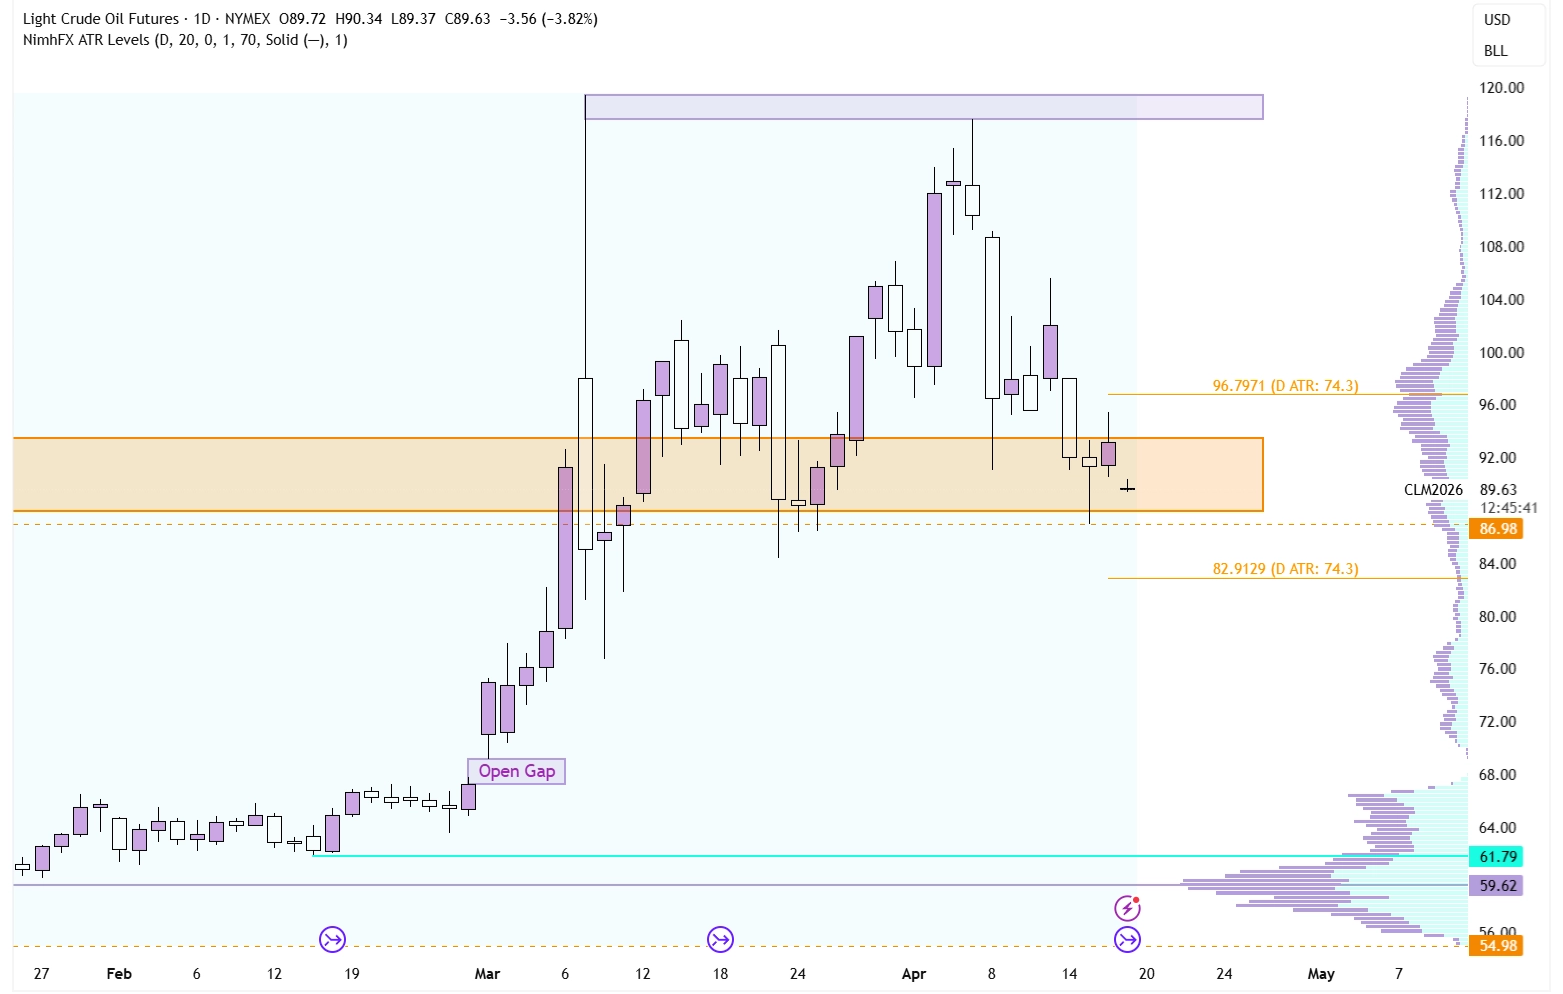
Oil on the Daily Timeframe
That picture has changed ever so slightly. Following the Weekly Open on Monday, price tried to push up but was pushed down for the remainder of the week. With price now back to our $88-94 support level for the third time in two weeks, and with the last bounce lasting for just one day, the technicals look more bearish here.
Usually, when you see a test of a support level, and you expect it to hold, you want to see a good and strong reaction from that zone, which is not the case at all here.
However, that doesn’t translate into a guaranteed breakdown of this level. Technical Analysis reveals to us the cumulative picture of all market participants and how they think the market will evolve. What TA cannot account for, however, is currently unknown news, like a further escalation of the war or a targeted effort to block global traffic.
Conclusion
One-sentence summary of the week:
Stocks See a Monster Rally Even Though Oil is Unable to Break Down