Introduction
Welcome to the first full trading week of 2026. Things are off to an interesting start, to say the least, so let’s get into it.
Global Macro
American Labor Market & Interest Rate Expectations
This week’s narrative was dominated by geopolitical fears; however, we saw very little of that spill over into financial markets. Instead, the attention is focused on Friday’s Non-Farm Payrolls as the American Purchasing Manager Index gave mixed signals earlier in the week.
Fed Governor Stephen Miran came out on Thursday saying that he wanted to cut 150 basis points this year. However, markets are so far only pricing in 50bps of rate cuts this year. While Miran is just one out of twelve voting members in the Fed, we are expected to see a more dovish Fed governor appointed in May as Powell’s term expires.
Australian Inflation
Historically, the Reserve Bank of New Zealand and the Reserve Bank of Australia have seen their interest rates at relatively similar levels, as both countries dealt with similar issues. However, recently we have seen a stark divergence between the two. As inflation fell in New Zealand, the RBNZ was able to aggressively cut rates and give more breathing room to the economy. Over in Australia, however, inflation started rising, which led to the RBA being forced to keep interest rates stable into the second half of 2025.

Wednesday’s print was the first move in the right direction, as inflation came out at 3.4% rather than the expected 3.6%. While rate cuts aren’t expected soon, the positive surprise does allow the RBA to hold rates, rather than having to raise them, as was expected earlier.
Equities
Despite geopolitical fears, indices have been off to a great start. The S&P 500 created new all-time highs on Wednesday, as did the Nikkei a day earlier. Interestingly enough, it’s the NASDAQ that’s falling behind, still unable to find new ATHs, while it’s the European indices that are leading the charge.

Euro Stoxx on the Daily Timeframe
The Euro Stoxx 50, consisting of the 50 biggest Euro-zone stocks, along with the DAX (Germany’s 40 biggest stocks), are well beyond their former ATHs, with the FESX not being too far off a historic €6,000. Last year brought an unexpected halt to American superiority as European indices, when accounting for currency change,s saw the strongest returns.
The question thus becomes whether the DAX and Euro Stoxx 50 will continue that momentum into this year.
Forex
The Dollar had a very strong week, up against all other major currency pairs. USDCHF has been in an incredibly well-defined range ever since August of 2025.
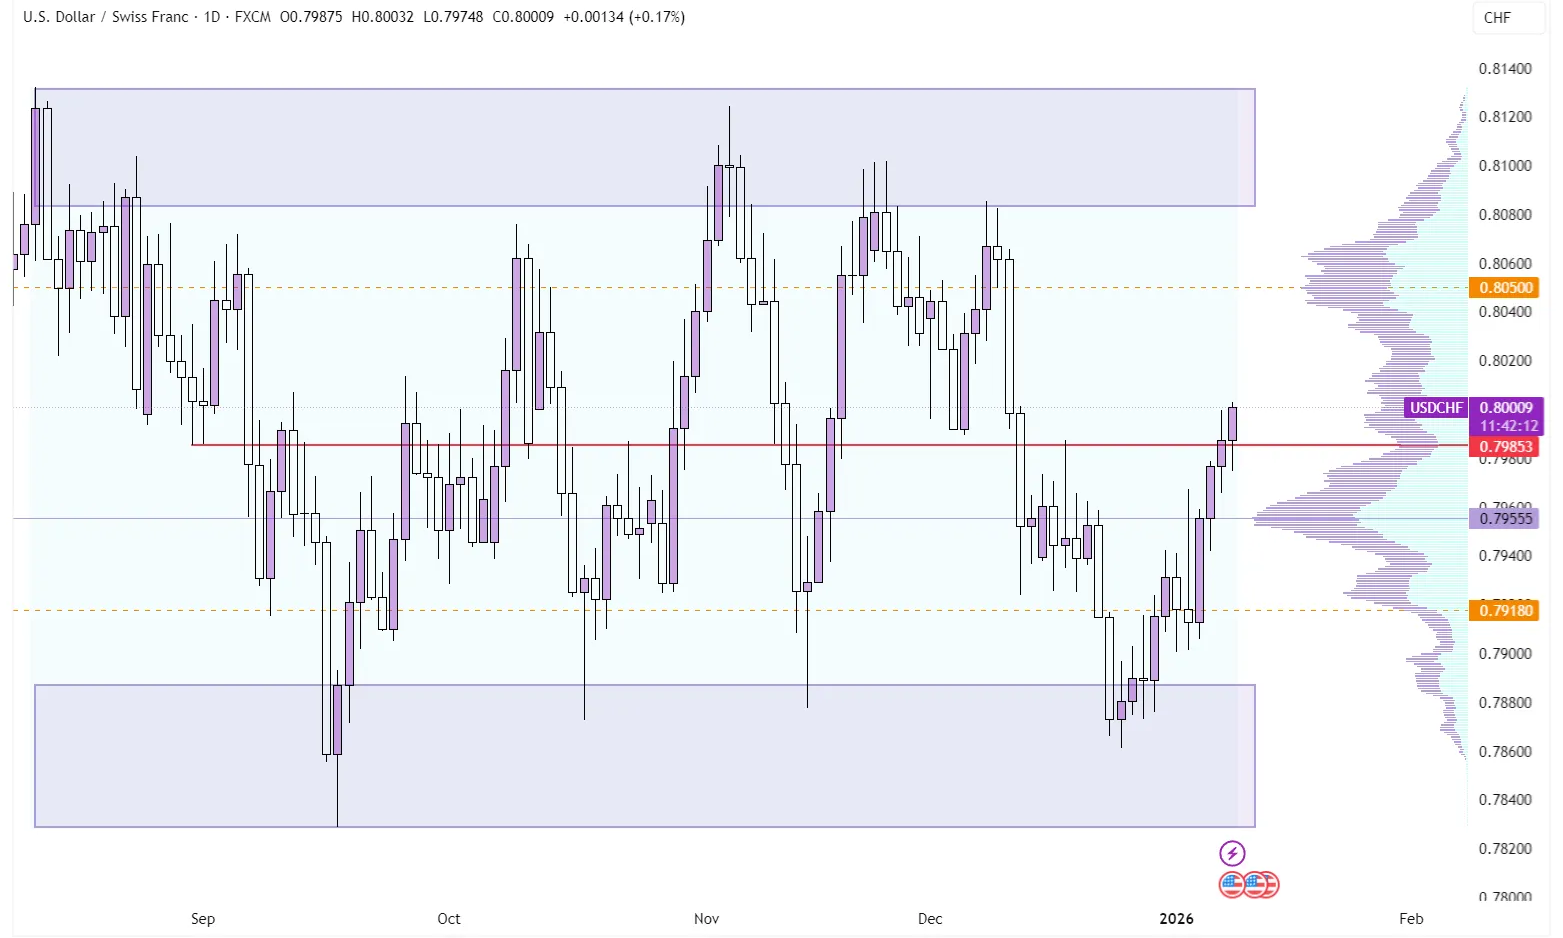
USDCHF on the Daily Timeframe
With price now being right in the middle of this range, it seems most likely that price will spend the next couple of days/weeks ranging. The upside and downside targets are the ones defined by the range Volume Profile, respectively, at $0.85 to the upside and $0.792 to the downside.
Note: While exact volume data on FX pairs is generally considered to be inaccurate since the market is dominated by Over-The-Counter transactions, the data is still relevant for our analysis. As long as the goal isn’t to identify orderflow-specific anomalies such as absorption or delta divergence, tick volume data can still help us locate likely support and resistance zones.
Commodities
This week’s worldwide headline surely was the kidnapping of Venezuela’s president by the American government. However, Oil prices stayed relatively calm, with the current week’s price action seemingly unrelated to any major headline news.

While the situation is still very much uncertain, the expectation seems to be that Trump will take hold of the Oil production and significantly expand its output to keep a damper on Oil prices. While prices remain relatively stable so far, with prices sitting right on its range Volume Point of Control, the situation remains critical.
Down the line, scaled-up production might cause tensions within the OPEC cartel as they could be forced to reduce their own production to prevent a total price collapse (like in April of 2020).
Over in the hard metals corner, both Silver and Gold took a much-needed breather this week, as price action seems set to close as an Inside Week (where this Week’s range is entirely contained within the range of the week prior).
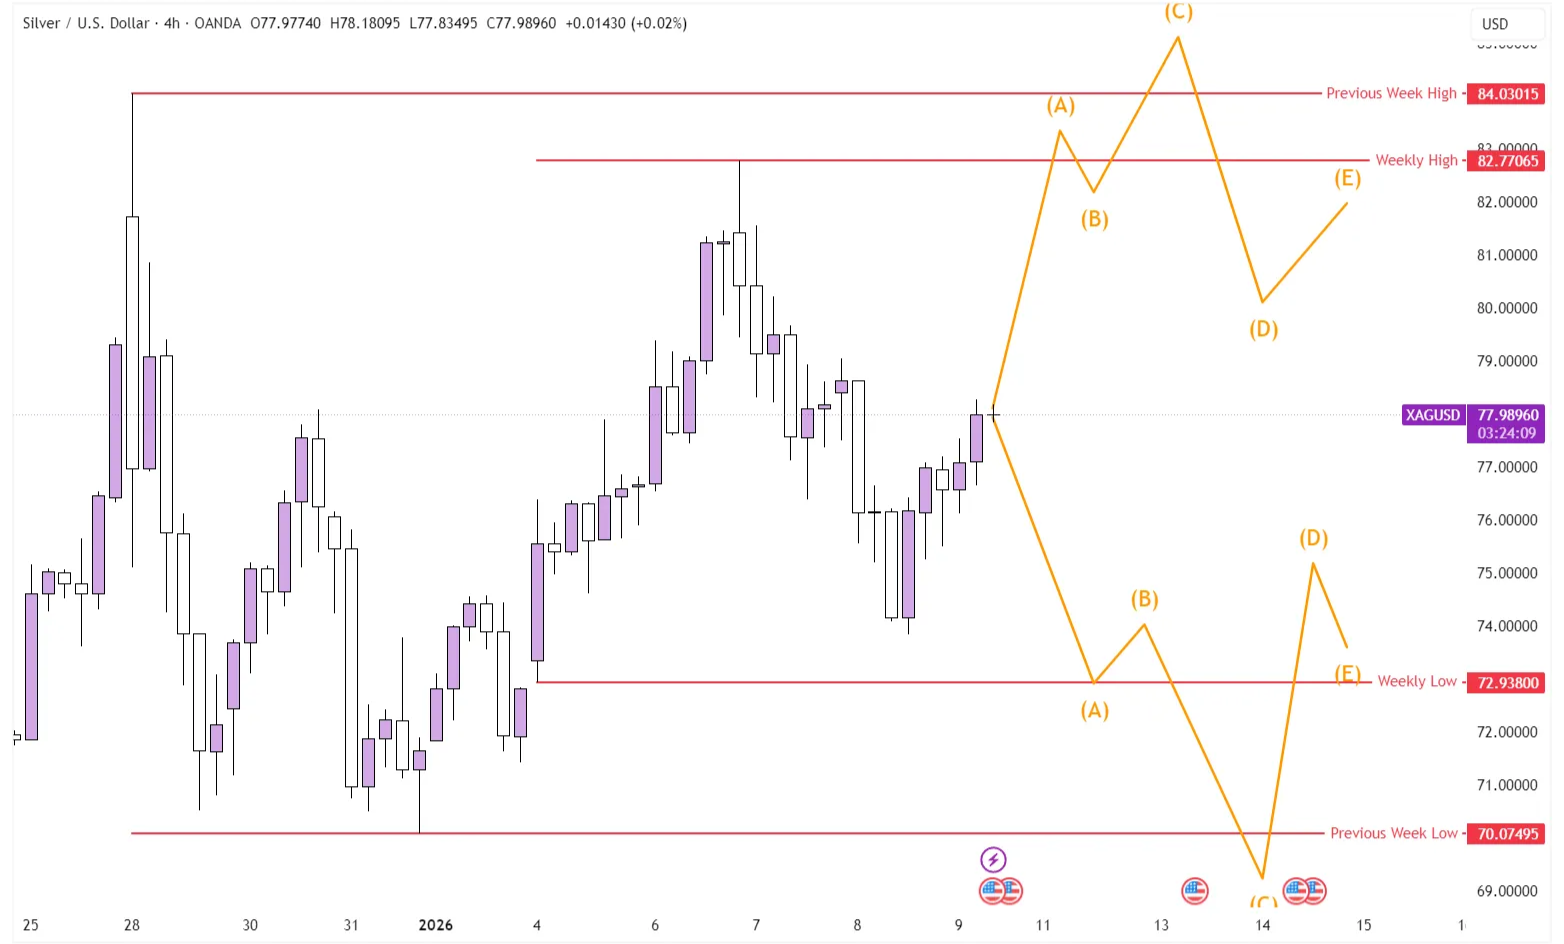
XAGUSD on the 4-hour Chart
While Inside Days/Weeks are often taught as a breakout pattern (i.e., follow the direction of the breakout), an often observed pattern is one where price probes just beyond the Inside Week High or Low to then reverse and eventually trap breakout traders, which causes them to unwind their position and accelerate the pace of the reverse.
This dynamic repeats itself because many traders are watching these key levels as they visually stand out. If their breakout trade fails, and the price reverts within the range, some of them start closing their positions. Since the closing of a position means trading in the opposite direction (i.e., closing a long position requires you to sell), we tend to see these cascades where quick reversals are possible.
Conclusion
One-sentence summary of the week:
Oil prices are stable despite geopolitics, European indices leading the charge, and Silver coiling in preparation for its next move.