Following the Iran - Israel/U.S. conflict, markets are still in a state of heightened volatility. In this article, we’ll analyze charts and help you successfully navigate this difficult period in the markets.
Oil
Still, the asset that requires most of our attention, Oil, is continually rising as the Strait of Hormuz has just a fraction of the ships passing through as normal. Since 20% of all global oil has to pass through here, the longer this problem continues, the higher Oil prices should go.
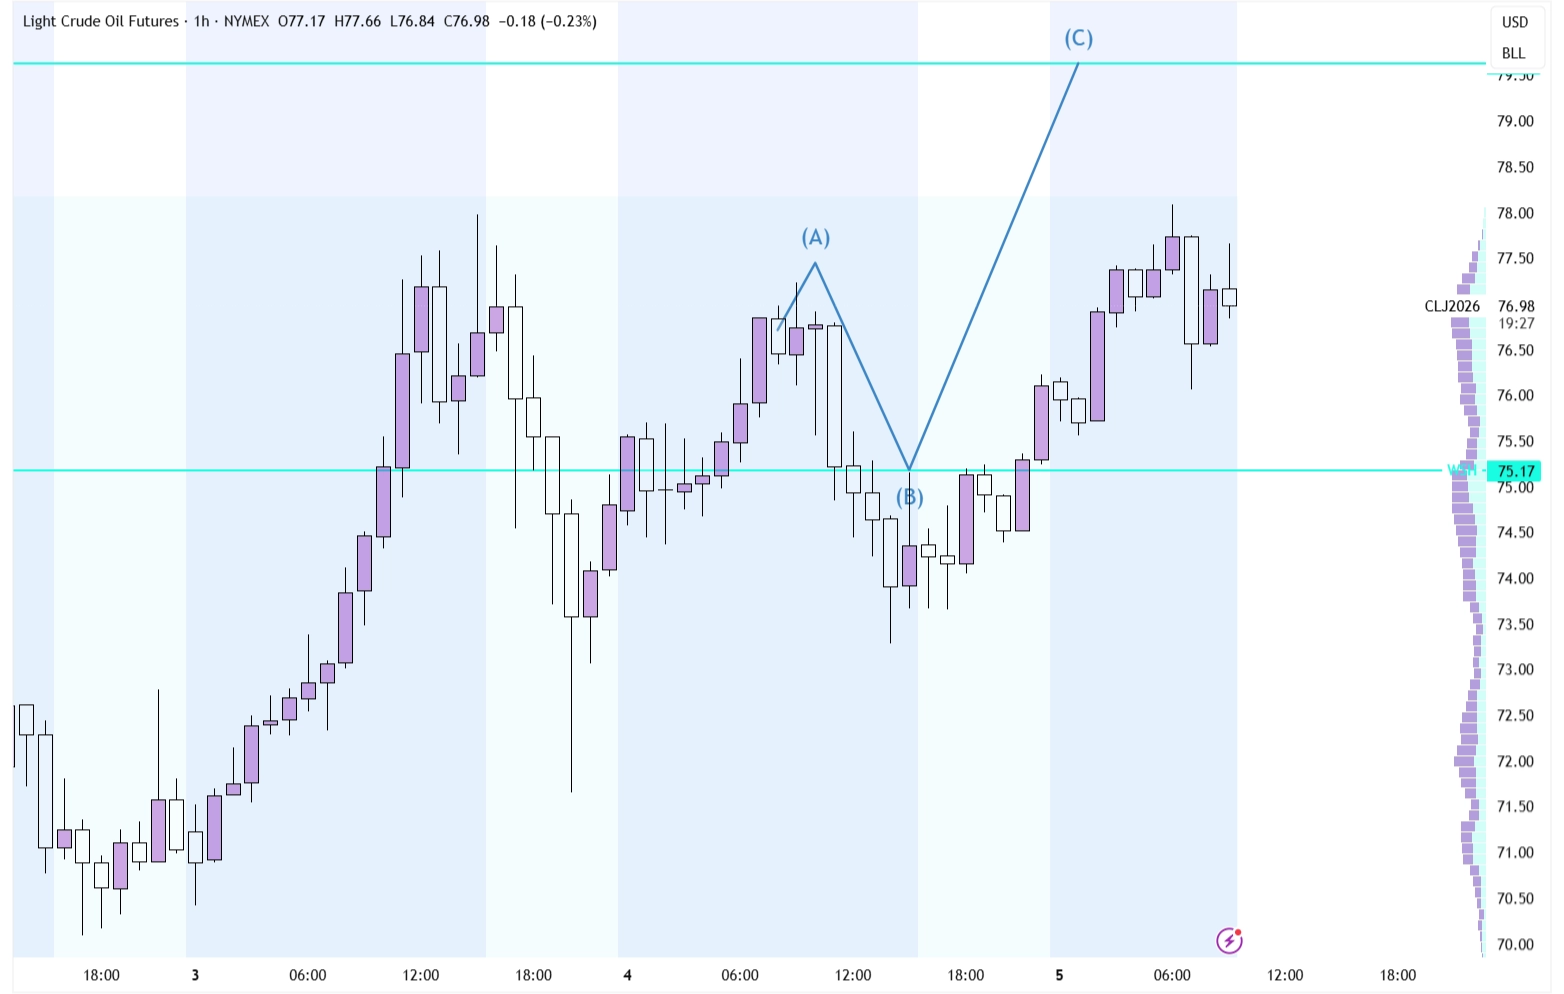
Oil on the 1-hour Timeframe
Yesterday, we shared an idea of what price action in Oil could look like for the coming 1-2 days, with price dipping to $75, finding support, and then moving to $80. Even though the bottom of the B-movement was lower than anticipated, the overall direction is still holding up, as the price is now in the middle of its B-C movement.
Neither the technical nor the fundamental outlook has changed since yesterday, as both suggest further upside potential.
For this bullish momentum to ease, a full and secure reopening of the Strait of Hormuz would likely be required. This would necessitate that the specific transit zone remains conflict-free, even if broader regional tensions persist.
Silver
So far, we’ve mostly been discussing Gold, which is seen as the true geopolitical hedge, but nonetheless, the technical picture in Silver is worth talking about as well. In contrast with Gold, Silver saw much less risk-off flows at the start of the week, rising comparatively less than its bigger brother.
However, price is still heavily correlated towards the downside; when Gold moves down, Silver is often quick to follow.
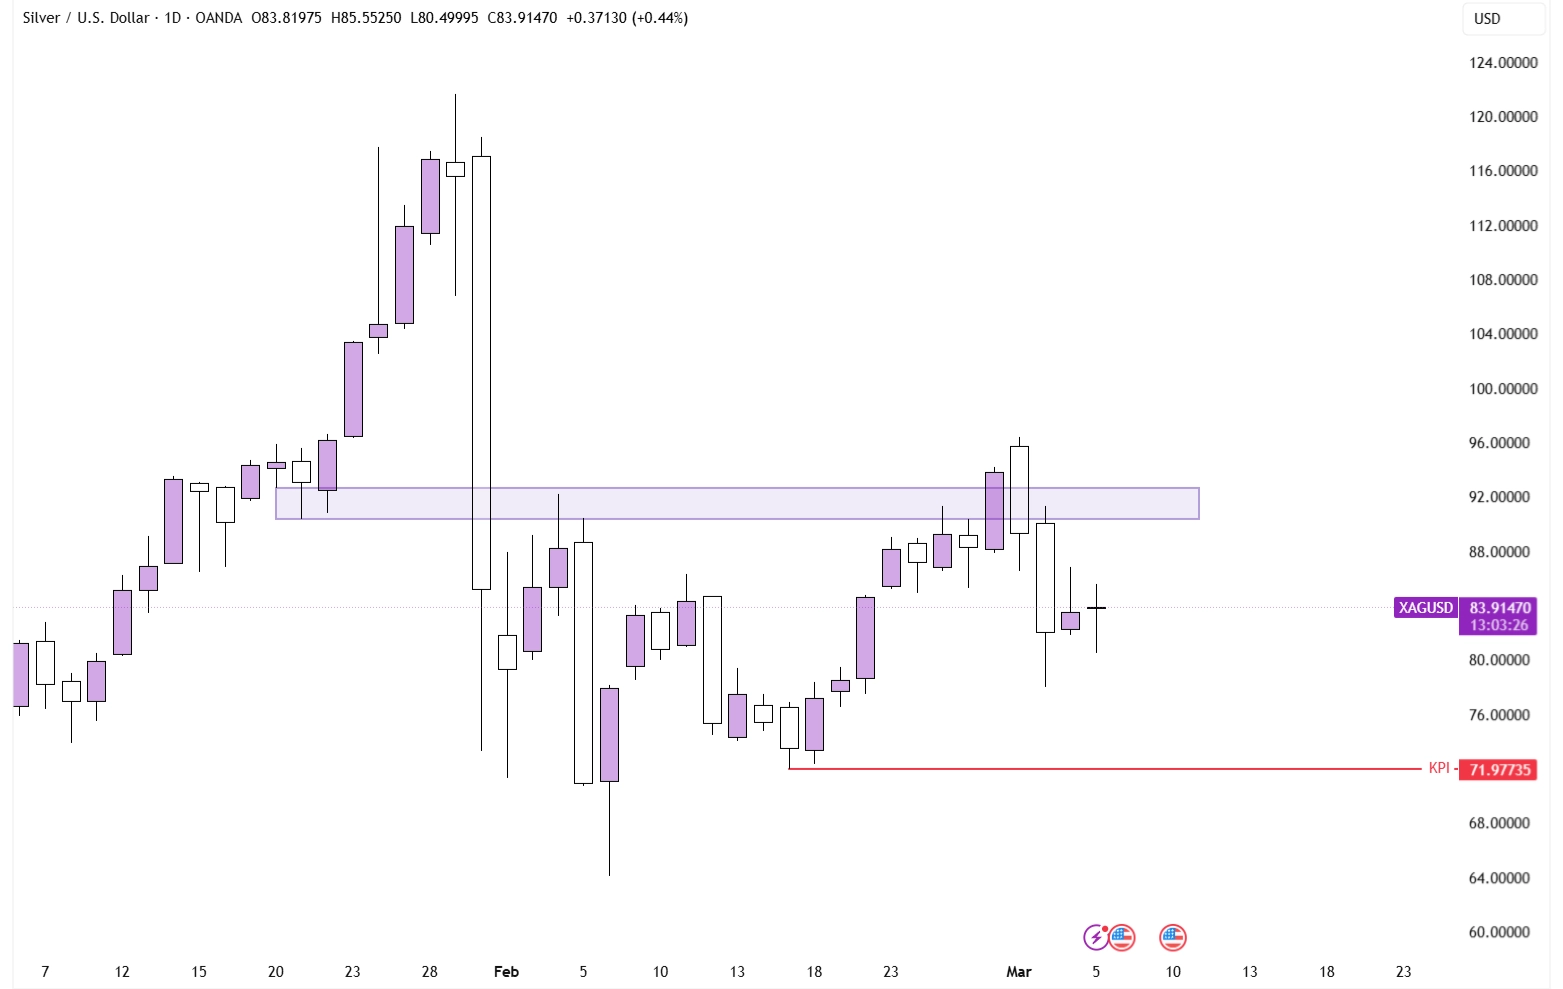
Silver on the Daily Timeframe
This creates a revealing dynamic: when a smaller correlated asset struggles to rally with the leader but is eager to drop with it, it often signals underlying weakness.
Even though Silver’s fundamentals are still bullish, the technical picture suggests buyers may be running out of steam. In that case, the Daily Swing Low at $72 would be the next logical target.
To invalidate this outlook, we would need to see price recapture the $90-92.5 range and hold it as support. In that case, a bullish bias would be warranted.
Nikkei 225
Among the major indices, the Nikkei has been particularly sensitive to this week’s risk-off rotation, dropping roughly 8% from its weekly high. Part of this was due to the same fears as on other indices: higher oil prices leading to higher inflation and thus higher interest rates. But there is also a gravity element at play. Given the Nikkei's recent bull run, the index was arguably overdue for a corrective move regardless of the headlines.
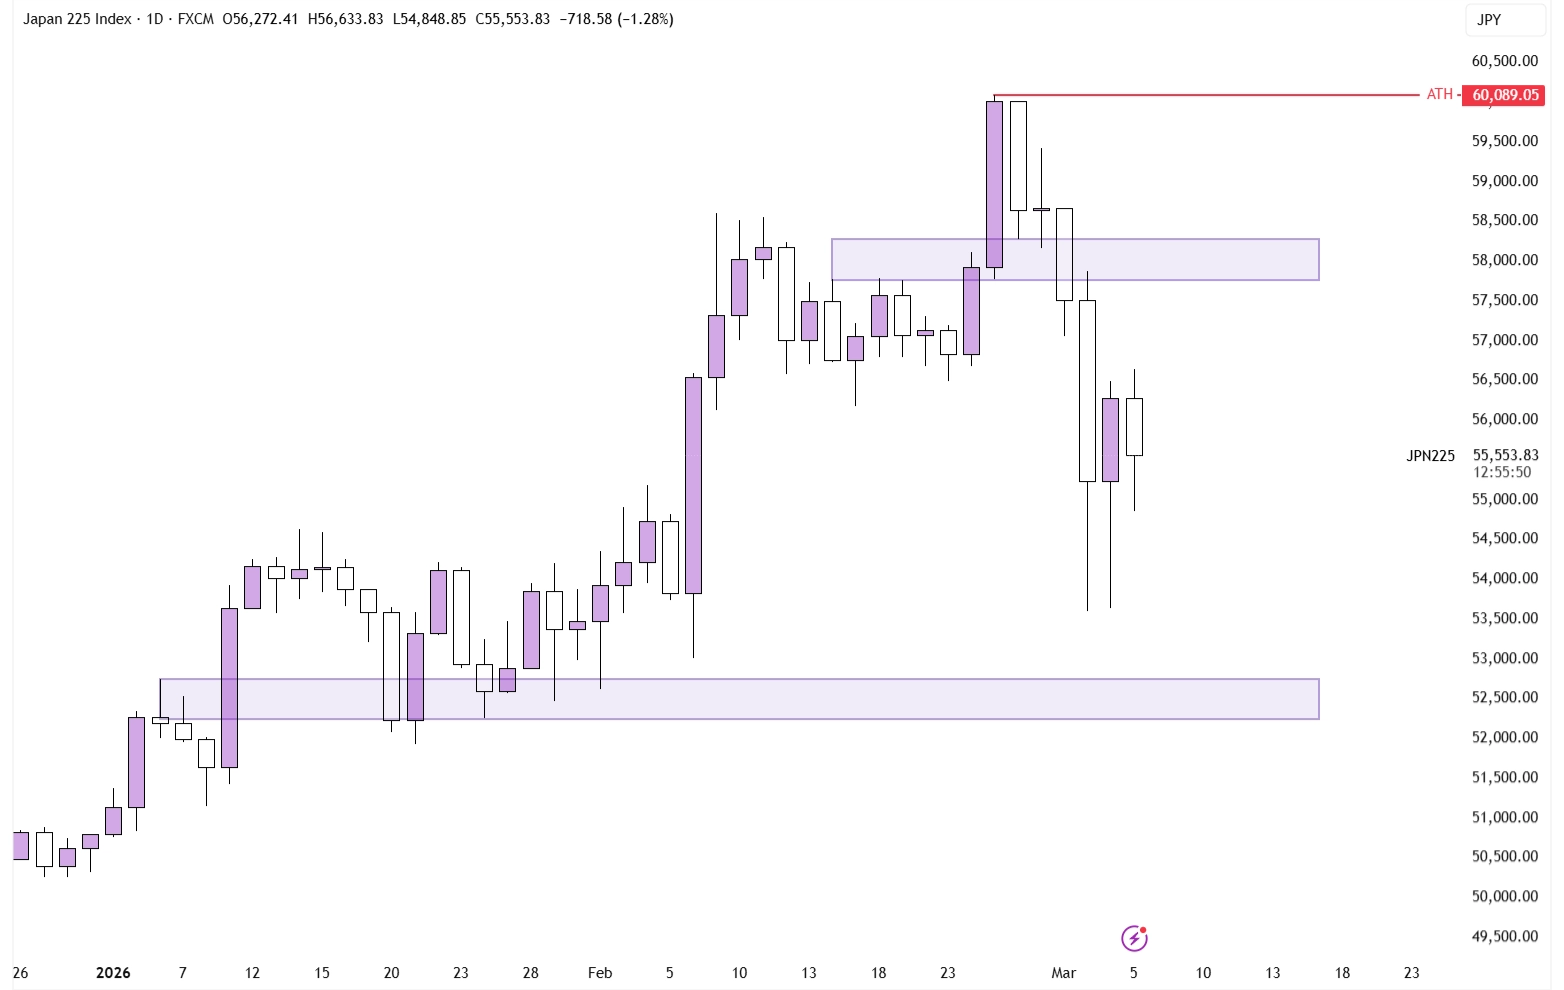
Nikkei on the Daily Timeframe
From a technical picture, it’s hard to see what way the market is tipping its hand here. Price sits right in the middle of a clearly defined range, with no chart patterns indicating a desire to move to one specific direction. If anything, the most likely scenario here is consolidation, barring any additional fundamental drivers.
USD/JPY
Staying with the Japanese market, the USD/JPY is providing interesting price action. Currently price is bouncing on a clear Support/Resistance area, which, after having been flipped, now acts as solid support. Currently, the daily candle is showing a downside wick, indicating that the price is bouncing and might be eager to move up.
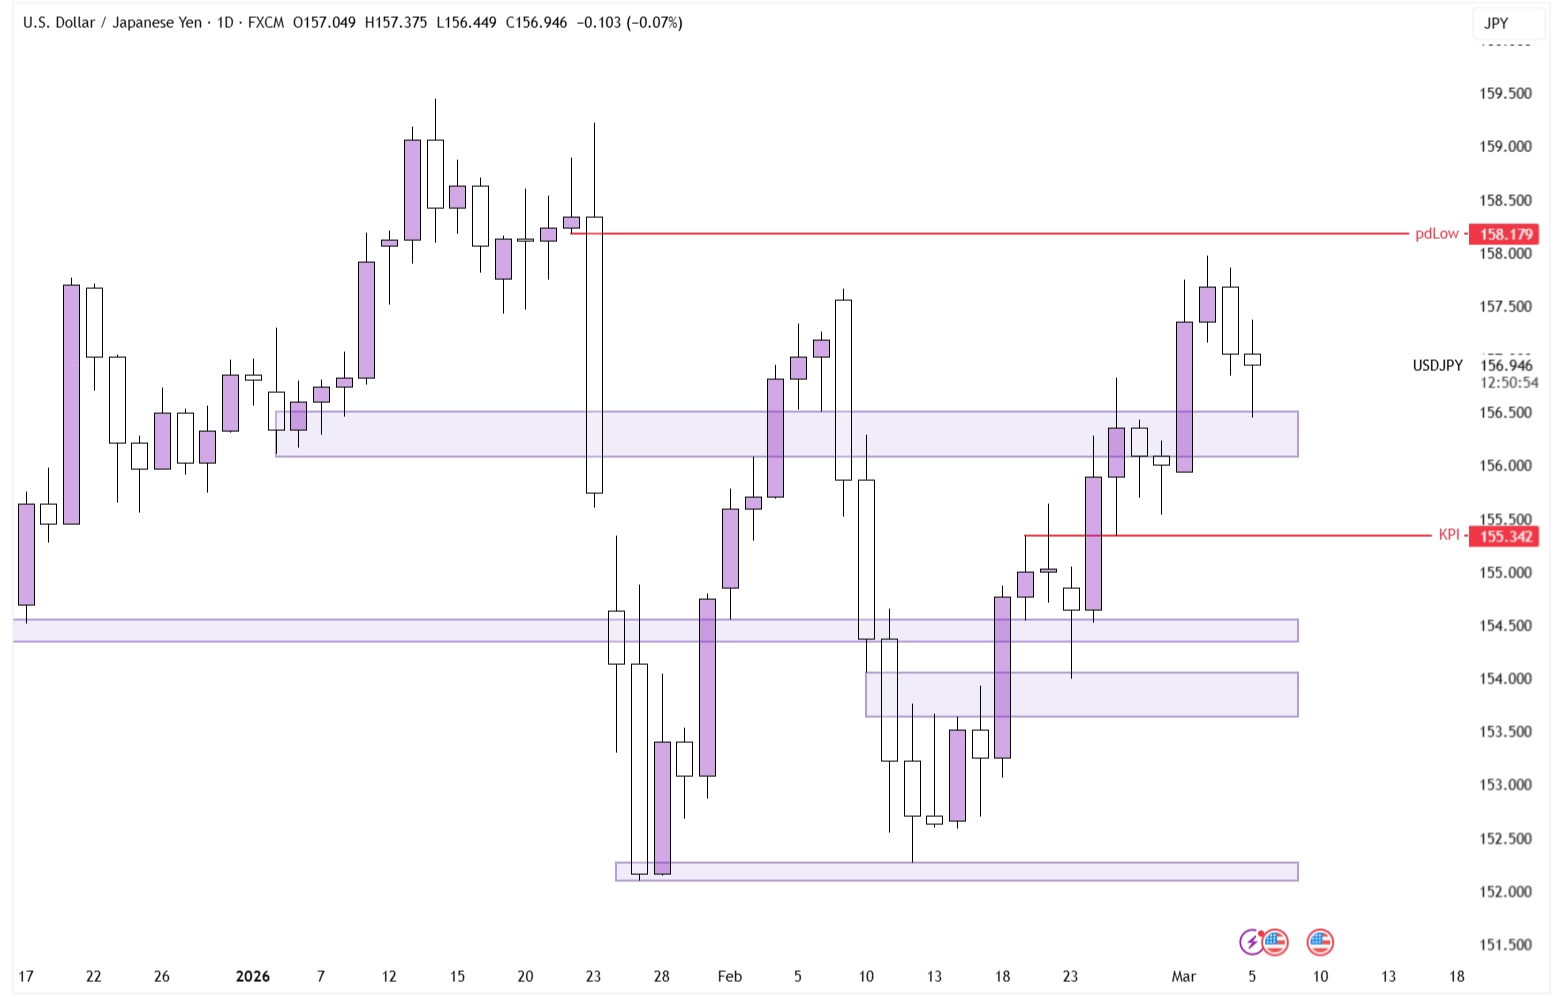
USD/JPY on the Daily Timeframe
At the same time, there is a logical target from a price action perspective. The low of the candle before a Bearish Engulfing is often a key reaction point, currently coming in at ¥158.179.
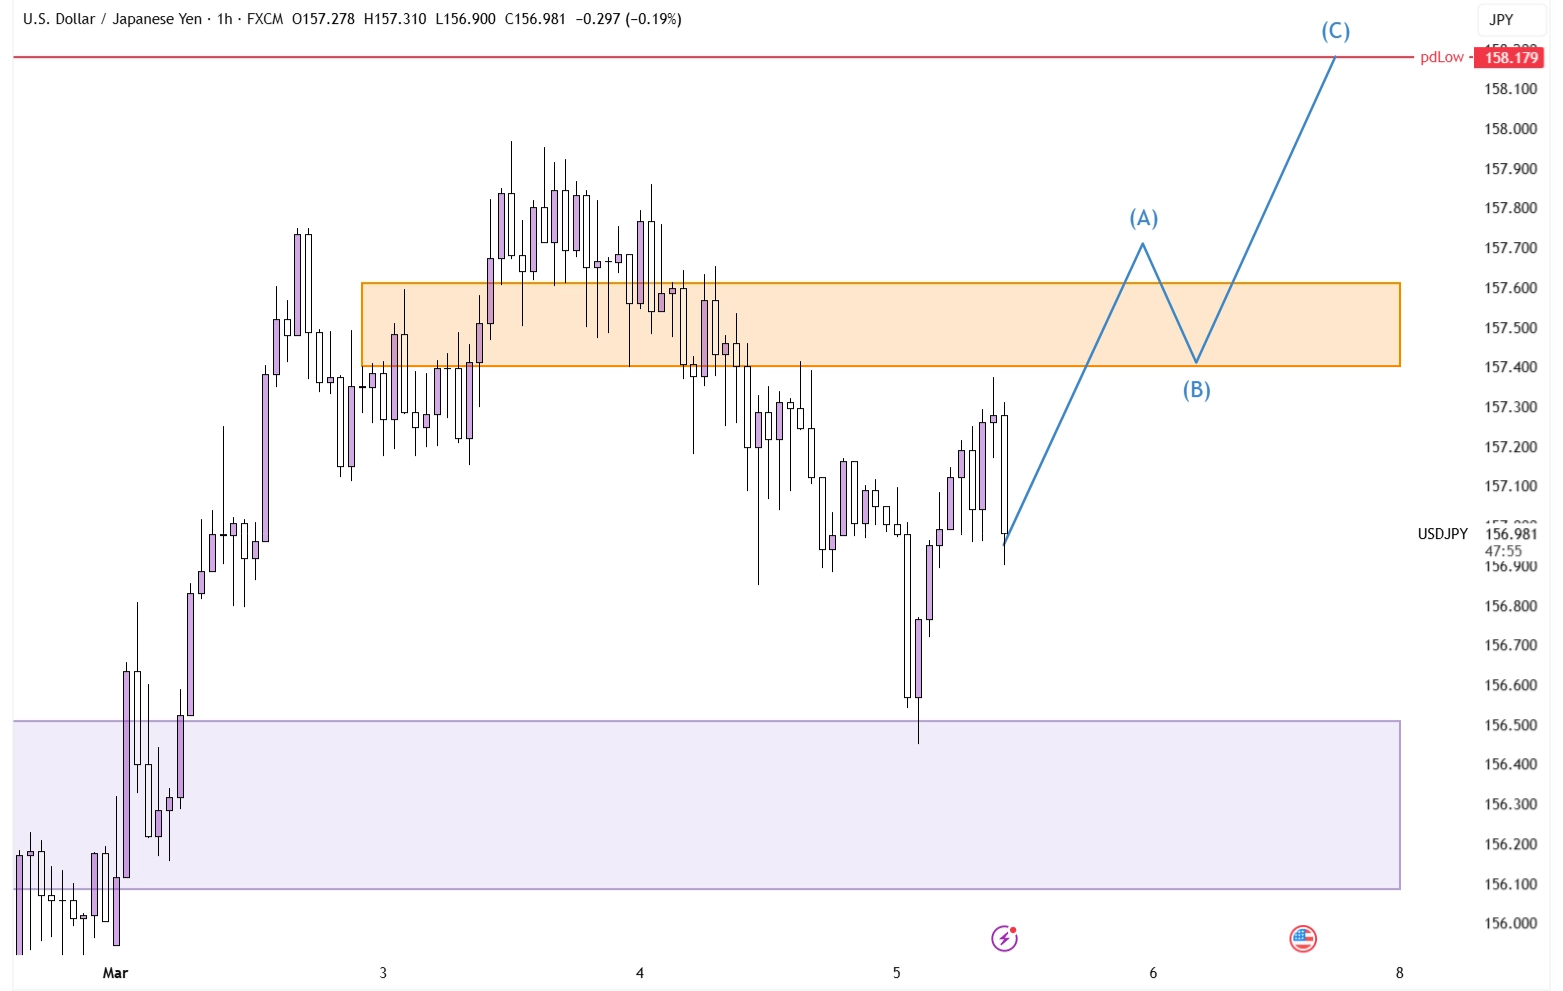
USD/JPY on the 1-hour Timeframe
Dropping down to the hourly timeframe, we can see a clear zone with old highs and lows right above the price. If price were able to flip that zone into support and hold at least the lower end, it would make sense for price to move up from there to ¥158.179.