Following this weekend’s geopolitical situation in the Middle East, the world has found itself in a state of turmoil. In this update, we will provide a timeline of the weekend’s events and analyze the subsequent impact across major asset classes to help you going forward.
What Happened? A Timeline of the Escalation
Saturday Morning: The Initial Strike
At approximately 03:45 Tehran Time on Saturday, a joint military operation was launched by U.S. and Israeli forces against Iranian targets. The strikes focused on critical infrastructure, including command centers, nuclear energy facilities, and various military installations.
The Passing of the Supreme Leader
Shortly after the initial wave of attacks, Iranian state media confirmed the death of Ayatollah Ali Khamenei following a strike on his residence. As the Supreme Leader (Rahbar), Khamenei held the ultimate authority over Iran’s political and religious direction.
His role was central to the state's function, as he held:
- Command of the Armed Forces: Final say over the Iranian Military and the Islamic Revolutionary Guard Corps (IRGC).
- Policy Control: Final decision-making power on foreign and nuclear policy.
- Media & Religion: Total oversight of state media and status as the nation's leading religious authority.
While interim leaders have been appointed to maintain state functions, the leadership structure is very sensitive to change.
The Counter-Response
In response, Iran launched retaliatory strikes against Israeli targets, as well as several U.S. bases and embassies throughout the Gulf states. Most critically for global commerce, the Iranian Navy has moved to close the Strait of Hormuz, a chokepoint vital to the world’s energy supply.
Market Reactions: A Quick Rundown
Because these events unfolded while exchanges were closed, the Monday Open saw significant price gaps and huge volatility as markets tried to price in our current altered situation.
Energies
Oil has been the primary focal point of the market's reaction. Front-month futures gapped up 7% at the open, hitting a high of $75.33 (up from last week’s peak of $67.83).
Capture the volatility as it happens.
Haven't registered with Axiory yet?
Create your account in minutes.
The closure of the Strait of Hormuz is the primary risk driver here; approximately 20% of the world’s oil supply passes through this channel. With regional trade currently halted, fears of a prolonged closure are dominating price action. A 20% supply disruption doesn't equate to a simple 20% price increase; instead, forecasts suggest Oil could exceed $100 per barrel. This is due to inelastic demand: the economic principle where consumers still require the product regardless of price, which can force costs exponentially higher in a supply crunch.
Metals
Gold was the second biggest mover. Instead of reacting specifically to the closure of the Strait of Hormuz, its surge is more attributable to a general rise in geopolitical uncertainty. Historically, as we see major conflicts, the initial reaction almost always triggers a flight to safety, of which Gold is the major beneficiary.
While prices are still underneath the former ATHs, price has clawed back almost all of their earlier losses, currently residing just 4% underneath the former ATH. Silver, on the other hand, has seen a much smaller reaction, initially gapping up, but immediately retracing this initial move. During these periods of conflict, the focus concentrates almost exclusively on Gold as it’s seen as the true geopolitical hedge.
Indices
Stock Indices saw the third biggest reaction, with the S&P 500, Nasdaq, Euro Stoxx, and Nikkei all gapping down 1-2%. As of Tuesday morning (CET), the S&P 500 and Nasdaq have been able to fill the gap, but the Euro Stoxx 50, Nikkei and DAX are all still down.
This sell-off is less about direct trade with Iran (which is relatively minimal for the U.S. and EU) and more about the inflationary implications. Rising oil prices act as a tax on the global economy and increase the likelihood that central banks will keep interest rates "higher for longer" to combat energy-driven inflation.
Forex
The currency market saw the most contained reaction. The U.S. Dollar (USD) has strengthened due to safe-haven flows, though some of that risk-off demand has been absorbed by Gold. The primary story in Forex remains the correlation between specific currencies and commodities, such as AUD/USD and USD/CAD
Technicals: Levels and Narratives to Watch
Crude Oil
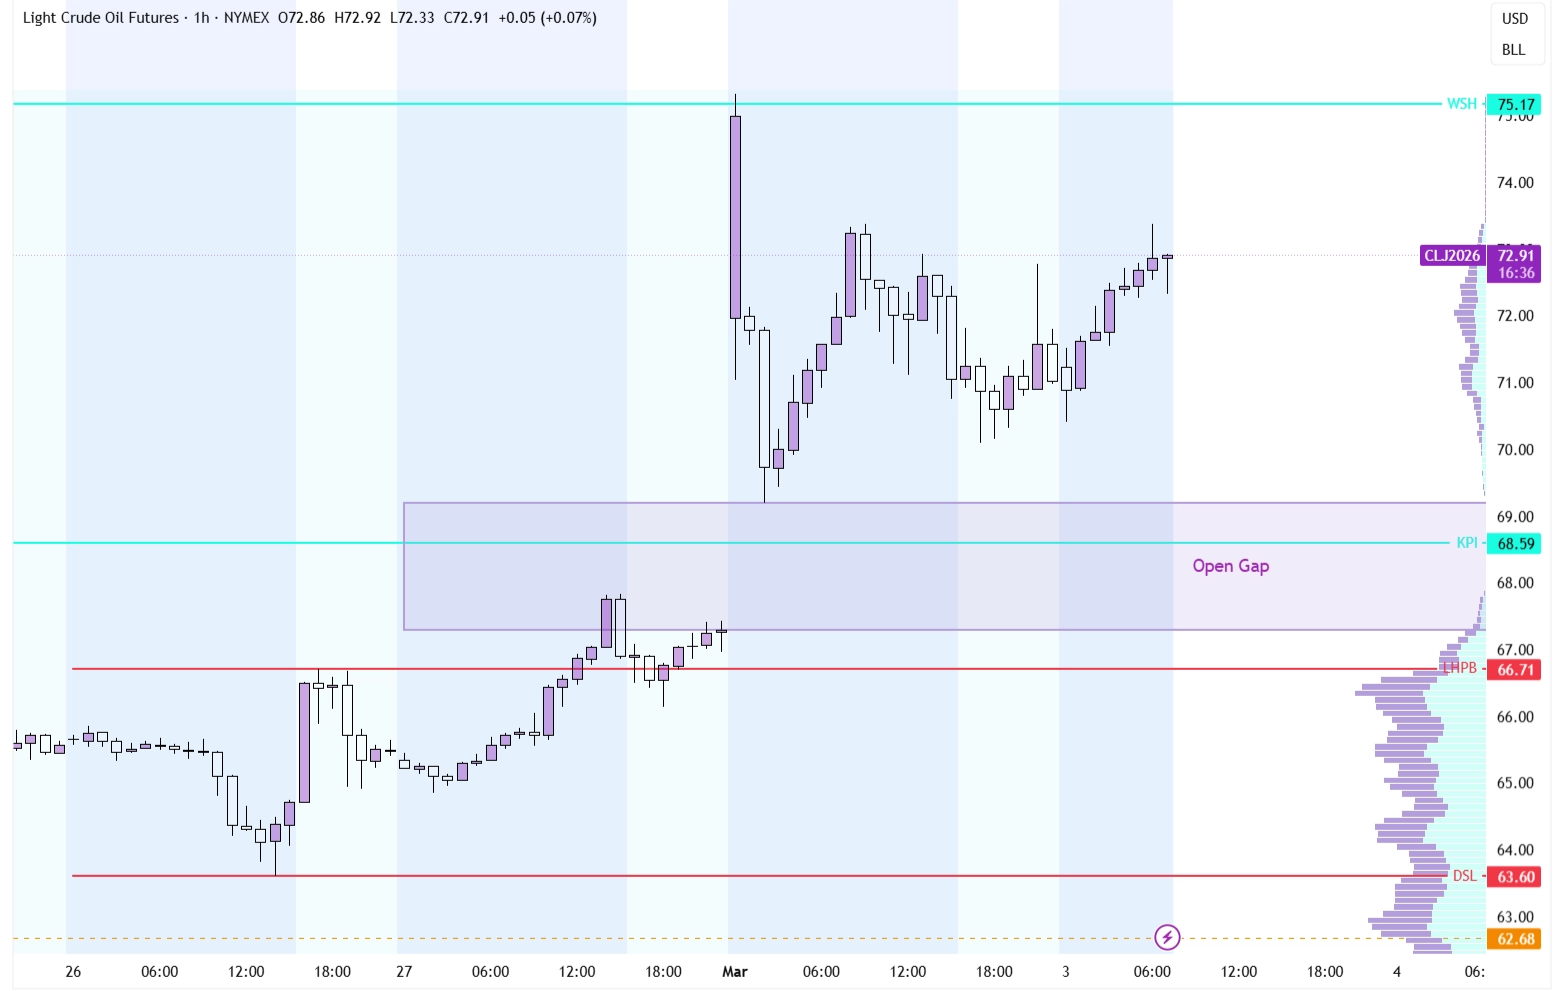
Crude Oil on the 1-hour Timeframe
Oil produced a massive gap at the open. General trading advice will teach you that more often than not, gaps close, and it would thus make sense to try to short the price back to its Friday close price.
However, the current picture is not that simple. Price didn’t gap open due to natural orderflow imbalances; it gapped up on a complete repricing of the asset itself. When prices are news-driven, open gaps are much less likely to close.
While the older Weekly Swing High at $75.17 has paused price advancements, any further escalation could easily see this level surpassed.
Gold
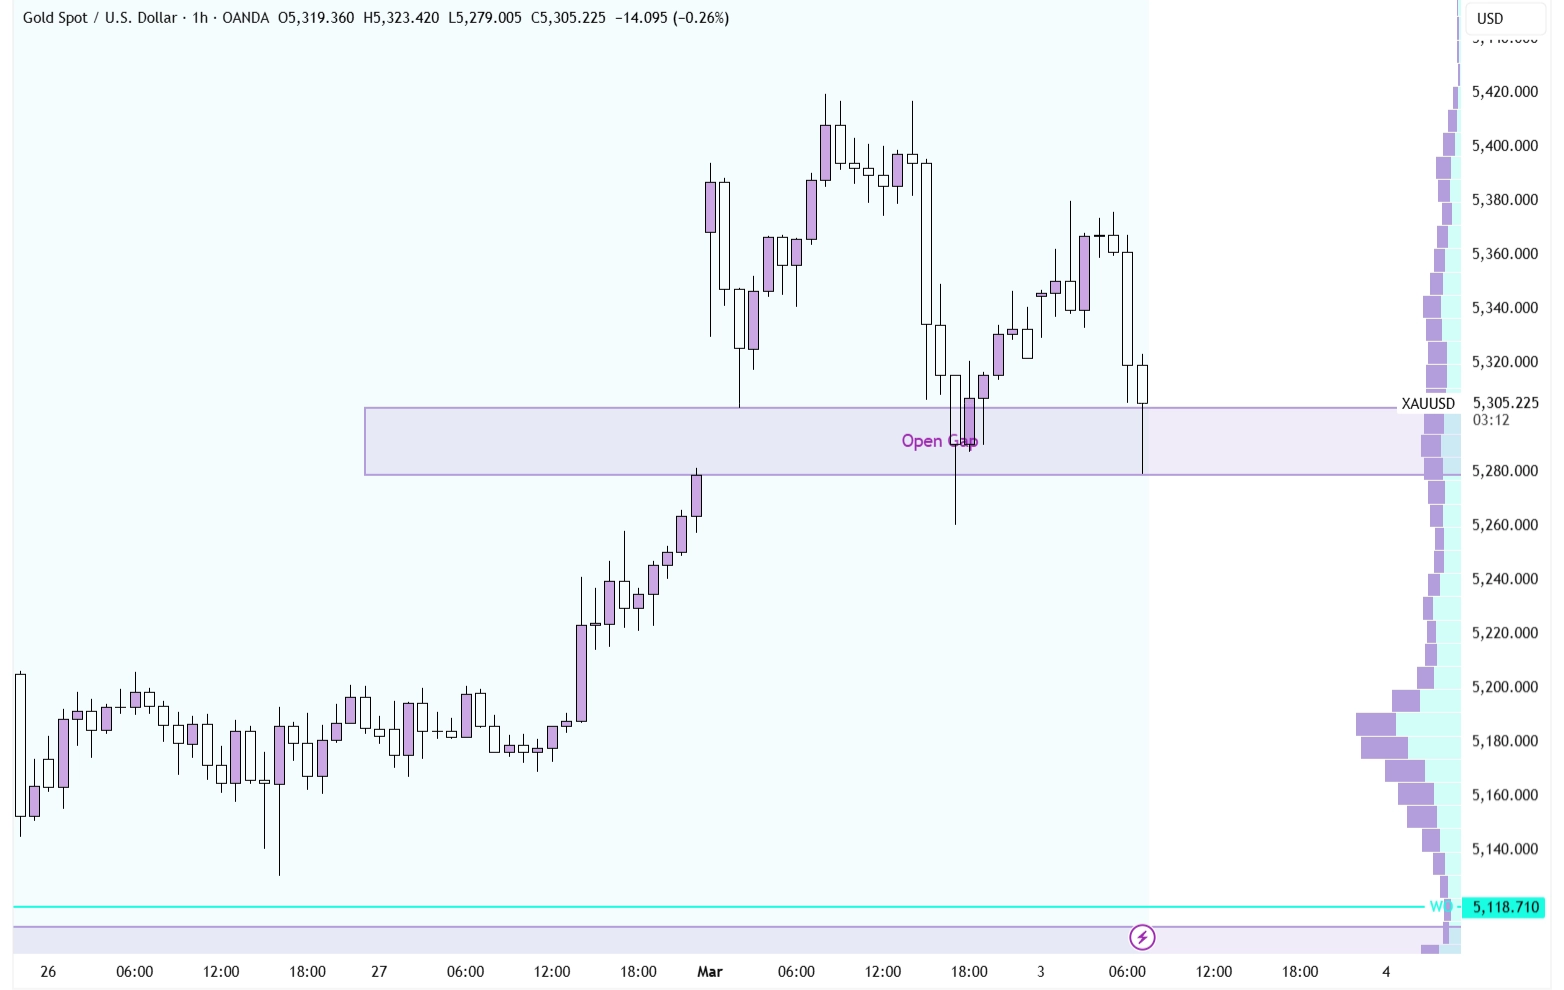
GOLD on the 1-hour Timeframe
Gold has been the primary recipient of the flight to safety, as prices initially gapped up but since then retraced lower to fill the open gap. At this point, it’s a question of wait and see.
It’s not abnormal for price to reverse when it has filled an open gap, and any major escalation would likely see price run for the $5,420 high it left on Monday. If price is able to reclaim that level, the path to new ATHs seems straightforward from a technical perspective, as there are no zones of resistance.
S&P 500
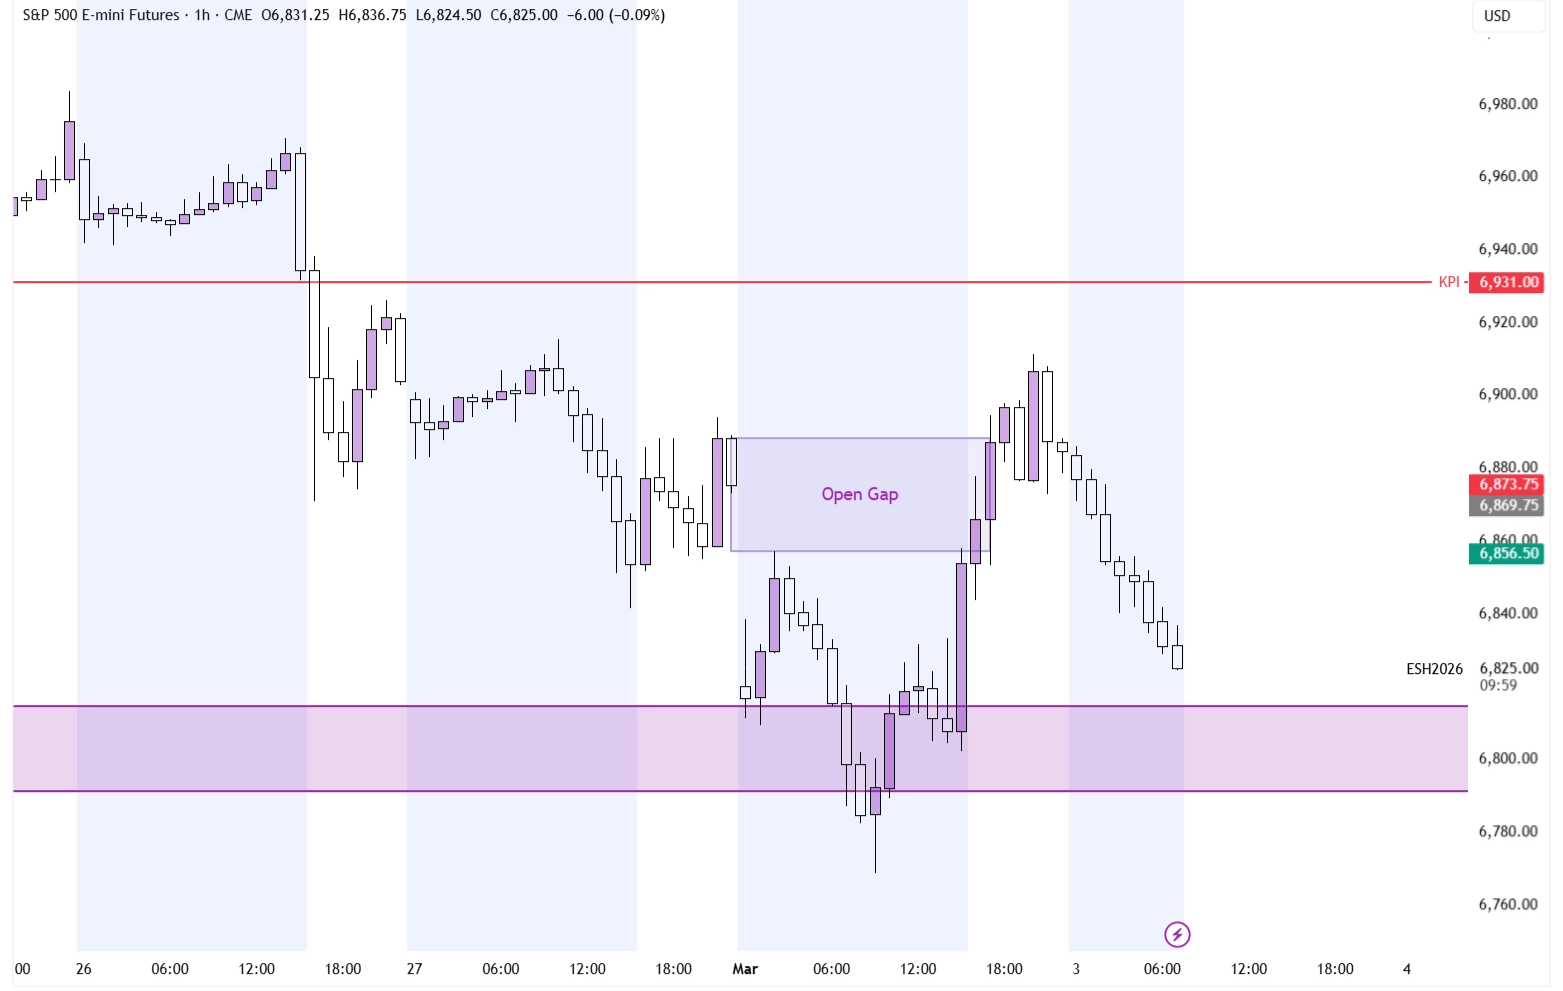
S&P 500 on the 1-hour Timeframe
Despite having filled the gap, the trend does still seem to be focused on the downside. Price is set on retesting the $6,790-6,815 area, which is expected to be weaker as it had only just been tested on Monday morning.
As mentioned earlier, the initial move of stock indices has mostly been attributable to fears about surging inflation. Oil and stock prices seem to be inversely correlated for the time being.
This means that if Oil goes up, stock indices are very likely to be dragged down. The risk in these markets is focused on the downside for now, not the upside. Despite the bullish economic backdrop in the U.S., Europe, and Japan, the focus is very firmly on this current crisis.
USD/CAD
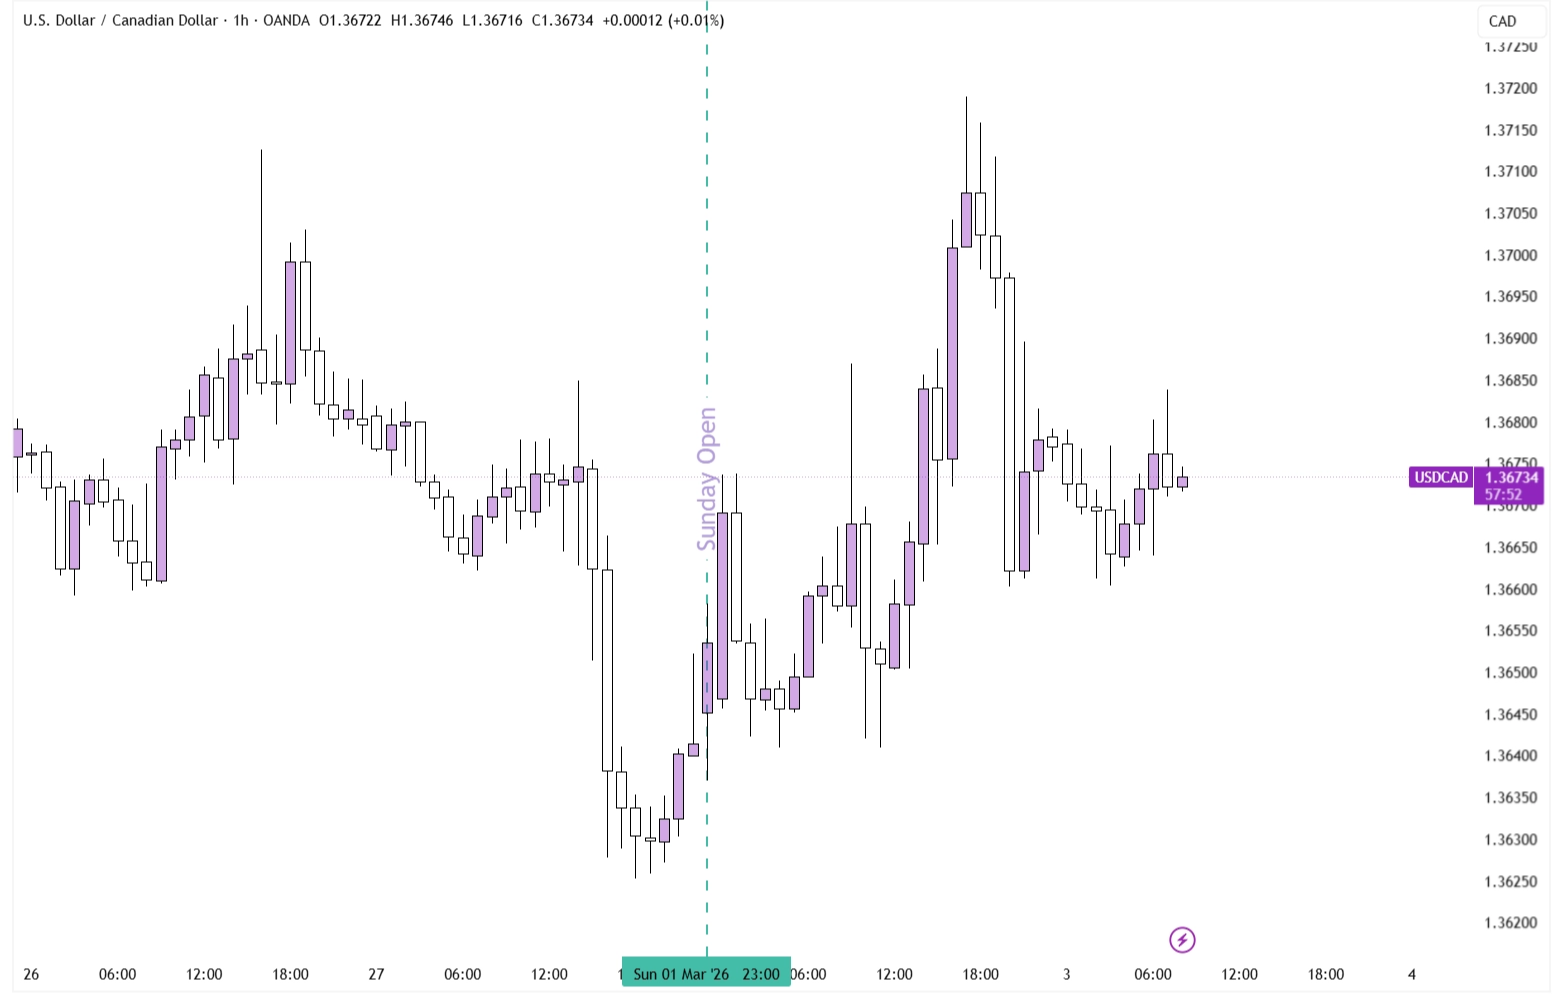
USD/CAD on the 1-hour Timeframe
The technical picture for USD/CAD is somewhat more complicated than it looks at first glance. Initially, it might seem like the reaction from USD/CAD is to be ignored, as the market opened right where it closed last Friday. However, this is because both sides of this asset are actively being repriced.
On the USD side of things, the Dollar Index has moved higher due to a combination of a flight to safety and higher expected interest rates. The reasoning here requires thinking a couple of steps ahead:
Due to the current closure of the Strait of Hormuz, oil flows are heavily impaired. If this persists, it would send oil prices much higher, potentially over $100 a barrel. Energy prices like oil are a major part of inflation, which in turn leads to central banks having to maintain higher interest rates. This makes the Dollar more interesting to hold, thus increasing its current worth.
On the Canadian side, prices are correlated to oil because so many Canadian exports are located in that sector. What is currently happening is that both sides of the pair are going up in relatively equal amounts, leading to a pair that seems unaffected but is actually the opposite.
Oil is the major asset to watch here if you trade USD/CAD, as it affects both sides of the pair.
Put this analysis into practice and explore the markets.
Haven't registered with Axiory yet? Create your account in minutes.