Introduction
Welcome to this week’s Market Pulse. Markets have officially decided that good news is bad news, with indices reacting negatively to better-than-expected unemployment data. In this edition, we are also taking a deep dive into two classic reversal patterns: hammers and shooting stars.
Global Macro
The week was dominated by the return of U.S. unemployment data. After previous signaling that October numbers might be delayed or unreliable, the market had priced in rather conservative expectations for the suspended September data.
However, Nonfarm Payrolls surprised to the upside. While robust employment figures are fundamentally healthy for the economy, the market’s reaction was decidedly bearish. Investors are currently fixated on interest rates, and strong labor data significantly reduces the likelihood of the Fed cutting rates further at the upcoming FOMC meeting.
Depending on how it impacts the rate-cut decision-making process, positive economic news can trigger a sell-off, which is exactly what played out here. The odds of a 25bps rate cut in December have plummeted from 97% (just before the October meeting) to current levels around 35%.
Equities
The surprise labor data triggered a broad sell-off across major indices. The S&P 500 was the standout: Thursday saw an initial push higher, only to be rejected and close sharply lower by the end of the session.
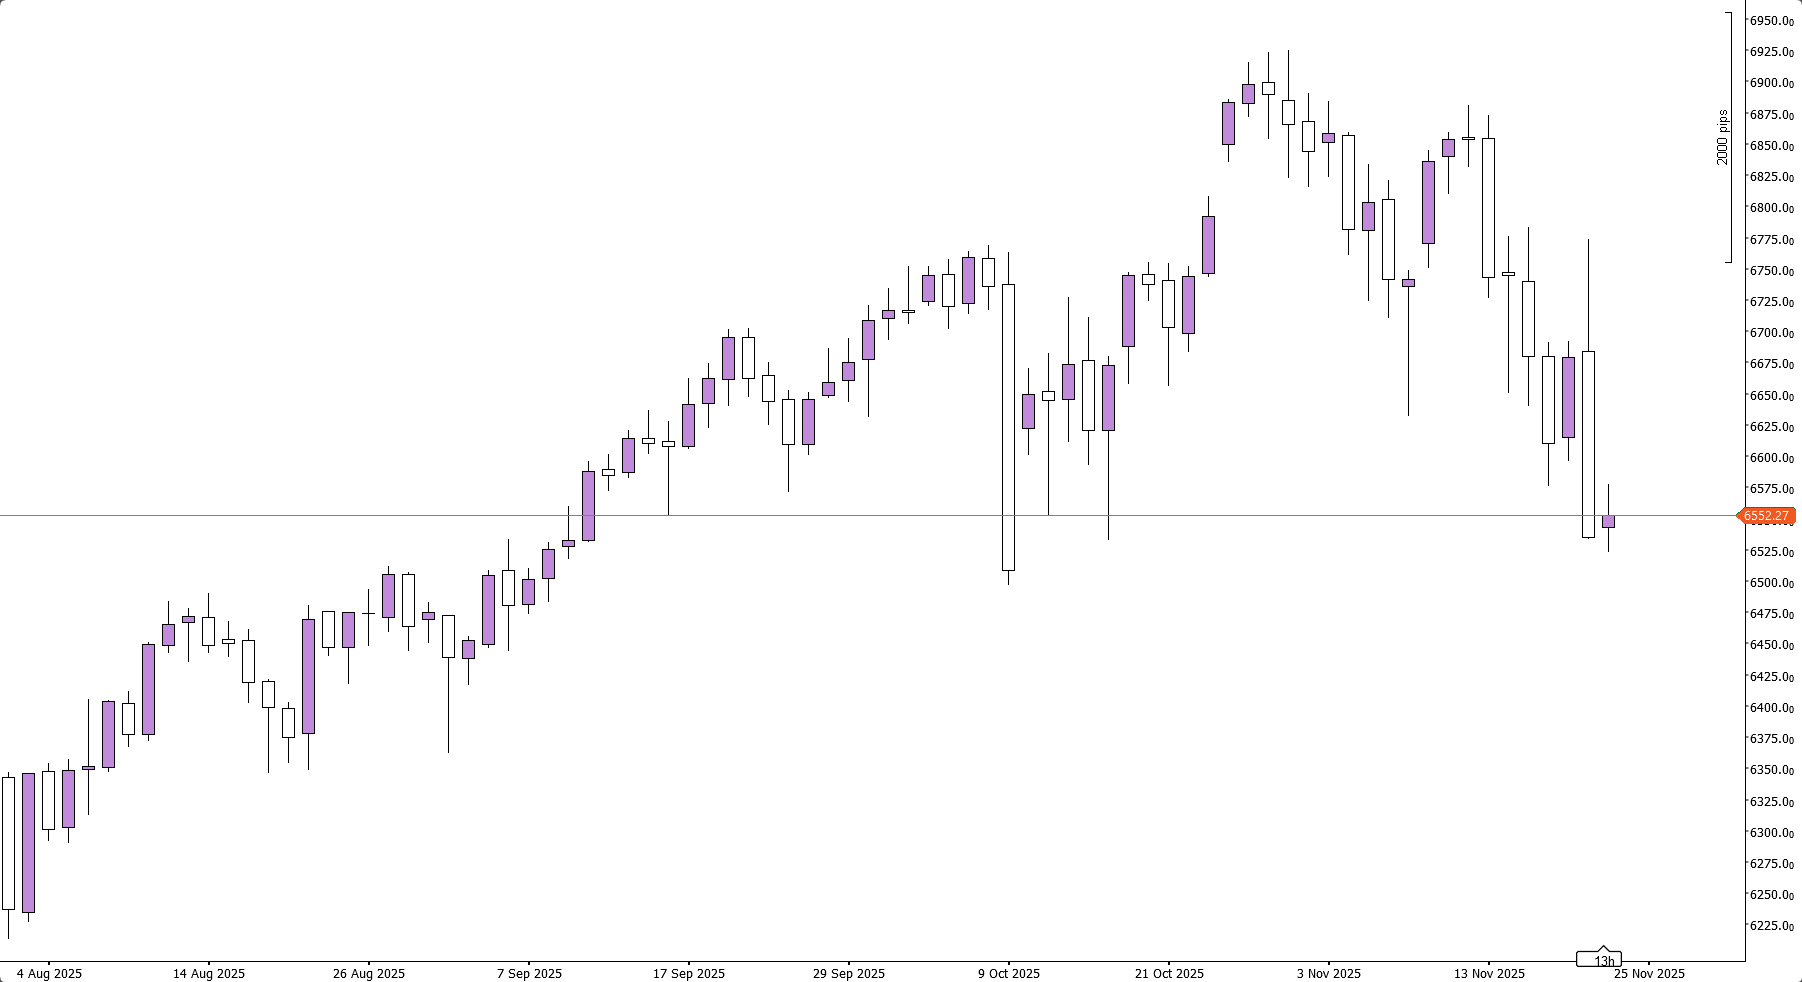
S&P 500 on a Daily Timeframe, showing Thursday’s rejection
Indices are now down 5-10%, which is the biggest drawdown for the S&P 500 and Nasdaq since the April tariffs. The trend seems to have shifted from a strong and consistent uptrend to perhaps the start of a period of ranging.
As we shared on X, prices have accepted within the first standard deviation band of the VWAP (Volume Weighted Average Price) anchored to the April lows. This gives strong evidence to this idea of a regime shift, as strong trends generally use the first standard deviation bands as dynamic support and resistance.
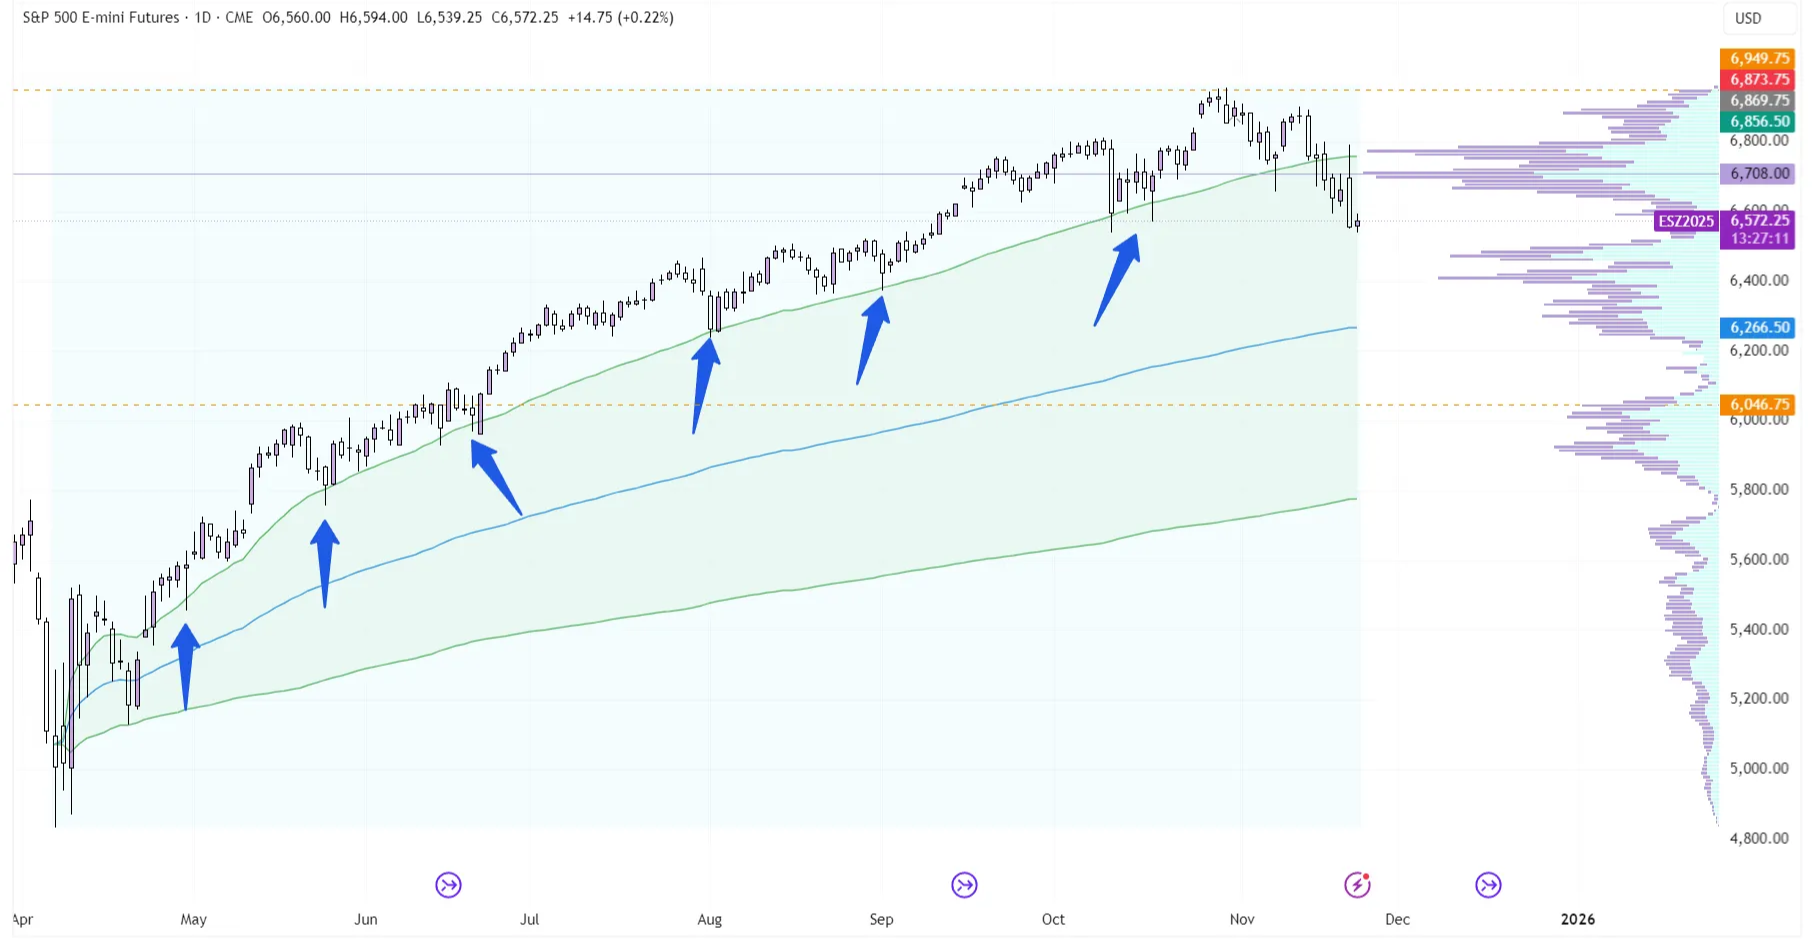
S&P 500 on Daily Timeframe, showing the VWAP Anchored to the April Lows
Thursday’s move down created even more confluence to this idea, as price retested the upper bands from the downside and is now durably accepting into the range. It’s likely that prices will now try to fill out the Low Volume Node (area where historically little volume has traded) between $6,500 and $6,600.
Forex
For all majors, it was a rather subdued week marked by U.S. Dollar strength, but with low volatility. USDCHF was an eye catcher however, as it created a clean ‘Hammer’ candle on the Daily timeframe last Friday. A hammer is when prices aggressively trade lower, in a larger than average candle, but eventually close with a relatively large downside wick and a small upside wick.
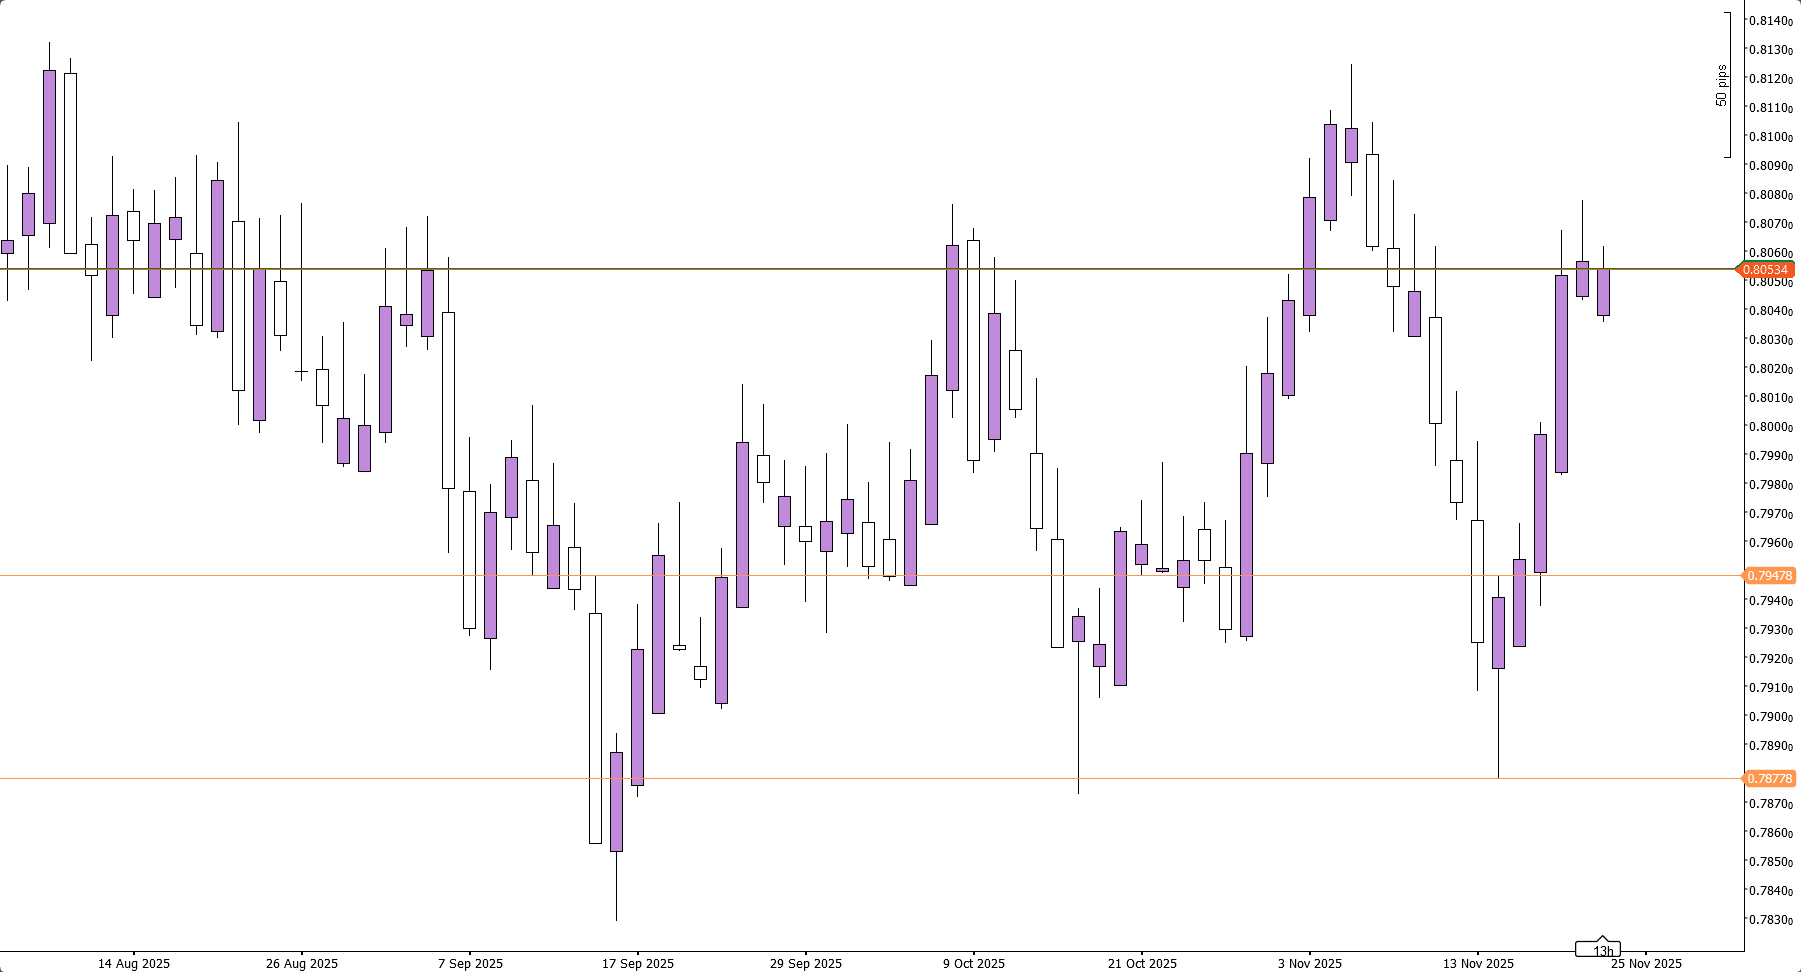
USDCHF on a Daily Timeframe
While Daily candle types on their own aren’t very reliable indicators, this one had some very strong confluence which made it a lot more likely to work. First off, Hammers are a reversal candle, so ideally you want to see one being preceded by a trend in the other direction. Here we had several days of price one timeframing lower (when the highs of the candles don’t get breached and price closes lower every day) which strongly added to this Hammer’s relevance.
On top of that, the bottom of the Daily hammer came in at a key support/resistance area. The 0.787 level had caused strong moves away from the level at two prior occasions.
Combining all of this insight, there was a very strong bullish bias coming into this week, which played out perfectly.
Commodities
Silver and Gold failed to retest their all-time highs and closed lower, continuing their ranging. However, prices are still holding up well, indicating that for now this is consolidation rather than a sign of a top in metals.
In Soybean prices, we saw the inverse of the Hammer pattern we just talked about earlier, i.e. a shooting star.
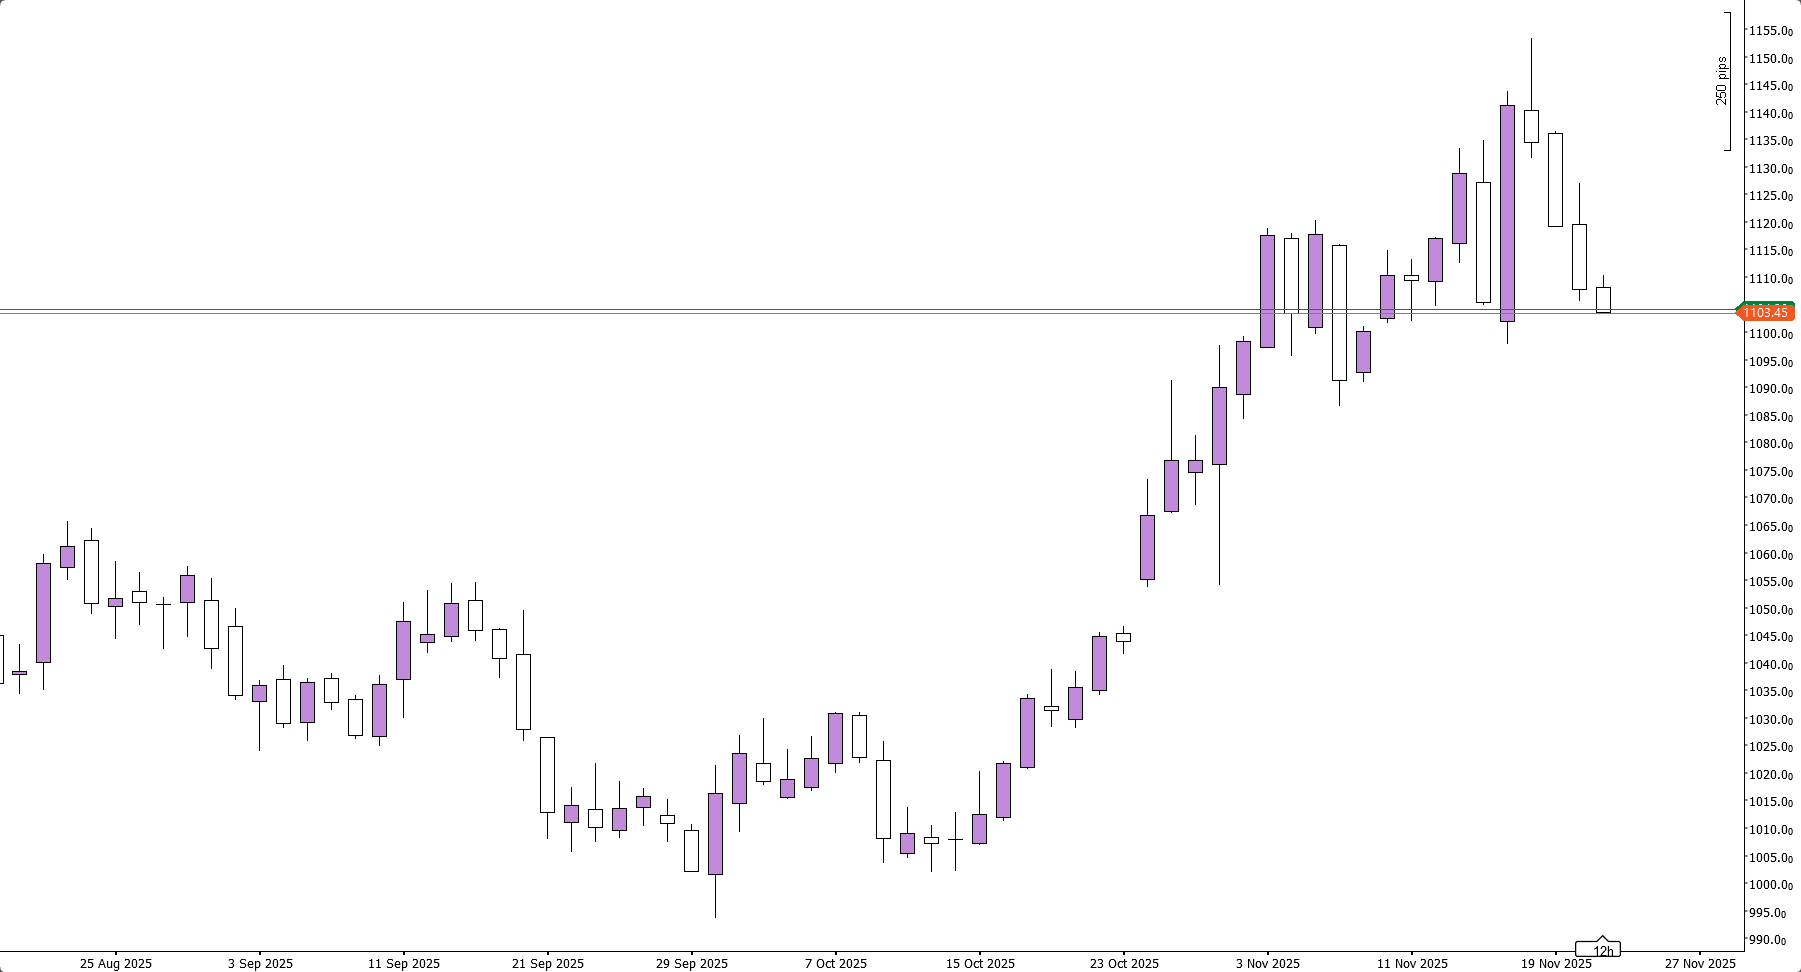
Soybean prices on the Daily Timeframe
However, the confluence of this particular candle isn’t nearly as interesting as the hammer we saw on USDCHF. The shooting star is happening in an area which doesn’t show any major support or resistance levels, and the trend of the days coming into this shooting star was ranging rather than trending. Especially the fact that the shooting star is preceded by a true bullish engulfing on the day prior, indicates that neither higher-timeframe buyers nor sellers are in control, which further diminishes the relevance of this particular shooting star.
It is important to remember that technical analysis is probability, not physics. Different traders interpret patterns differently. While the probability of this specific setup appears low, it remains possible that it could mark a local top.
Conclusion
One-sentence summary of the week:
Good news is bad news: Indices drop after better than expected employment data