Detecting patterns in price movements – Fractals for beginners
Technical analysis is focused on finding price patterns that are likely to repeat in the future. The fractal candlestick pattern is one of those patterns. What's more, there's a fractal indicator that can be used to locate fractals. Traders generally use fractals in combination with other indicators.
There are many indicators in Forex trading platforms that enable traders to discover those patterns. One such indicator is called fractal and while it may seem like a complex mathematical formula, it refers to a repeating pattern that occurs in a chaotic world of price fluctuations.
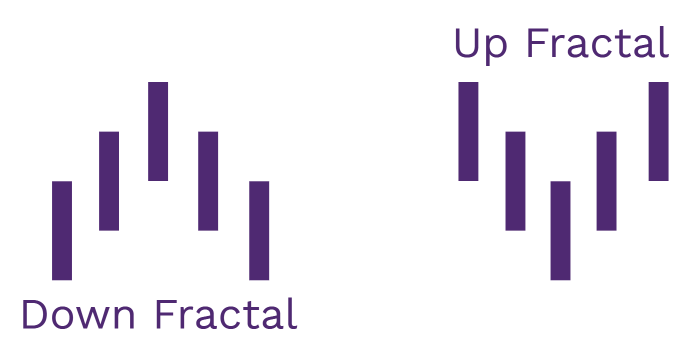
The pattern itself consists of five candles charted in a candlestick chart. The commonality between the different types of fractal indicators is that the price pattern looks like an arrow: at some point, the price increases, then it reaches its peak and starts to decline; on the flip side, the price decreases, then it reaches its peak and starts to increase. By observing these movements, traders can get an idea of when it is best to buy or sell a security.
Based on the previous description of patterns, we can outline two main fractal patterns in trading:
- Up fractal (bearish)
- Down fractal (bullish)

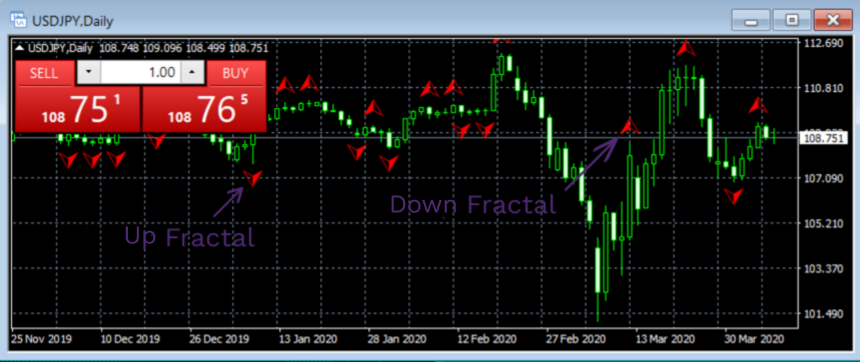
The up fractal, also known as the bearish fractal, occurs when the price has been increasing up until some point, then it reached its highest point and finally started to decrease. In a five-candle pattern plotted in a candlestick chart, this pattern can be identified as follows: the middle candle (a turning/reversing point) marks the highest high price in the chart, whereas the two hands on the left and the right mark lower high prices.
The down fractal, also known as the bullish fractal, occurs when the price has been decreasing up until some point, then it reaches the lowest price and starts to increase once again. The down fractal indicator in the trading chart looks like this: the middle candle of the bullish fractal marks the lowest low price, whereas the two hands on the left and the right mark the higher low prices.
The up-and-down fractals can be categorized in yet another way. When the outer hands of the pattern are symmetrical to each other, then the fractal is perfect; and when the outer hands don’t align against each other, the fractal is imperfect
How to use fractals in trading?
Fractals have become incremental to trading, therefore, almost all the popular trading platforms (MetaTrader 4/5, cTrader, etc.) are offering this indicator without additional installations. To toggle the Fractals' indicator MT4, the user has to go to the Insert menu in the top-right corner, go to the Indicators list, come down to Bill Williams, and select Fractals.
Then, the indicator will be added to the selected chart, and it will mark all the up/down patterns on it. As for the customizability, traders can choose the color of the arrows, as well as the timeframe.
To use an up or down fractal in trading, there is one essential requirement to it: the fifth candle has to close for a pattern to be recognized as a fractal. Otherwise, a signal received from the indicator will not be accurate. That’s because, before closing, the fifth candle can take an opposite direction and make the fractal disappear from the chart
Broken fractals
Once all the candles in a fractal are closed, traders can use the indicator to make decisions. One way of using fractals in Forex, or any other market, is to look for broken fractals. A broken fractal is a pattern that has been confirmed, but the next (sixth) candle went higher/lower than the highest/lowest point of the fractal.
For example, an up fractal can be considered broken if the next candle immediately after the fractal goes higher than the highest point of the fractal. This pattern suggests that the market is increasing (bullish) and therefore, it can be a good idea to buy an asset (go long).
Conversely, a down fractal can be considered broken if the next candle following the fractal goes lower than the lowest point of the fractal. This suggests that the market is declining (bearish) and it can be a good idea to sell an asset (go short).
Coupling with other indicators
When using fractals in actual trading, traders tend to notice one thing: fractals occur quite often in the chart. Therefore, they may not be the most accurate indicators on their own. That is why traders tend to use it in conjunction with other indicators.
One of the most popular technical indicators used alongside the fractal indicator is the alligator. The alligator is a trend confirmation indicator that consists of three moving averages. The three average trends can describe the trend movement more accurately and indicate whether it is going up or down.

Then, traders can use fractals to place a stop loss at a certain price point. For instance, during an uptrend, a trader can place a stop loss at the most recent low of the down fractal. This way, they will continue their long (buy) position as long as the price stays above the stop loss point.
For a downtrend, a trader can place a stop loss at the most recent high of the up fractal. This way, they will continue their short (sell) position as long as the price stays below the stop loss point. One additional step traders take to make this combination more accurate is to choose longer timeframes. By doing this, they reduce the number of fractals and make it easier to detect trading opportunities.
What does fractal mean in trading?
Forex fractals should be used in a context. Keep in mind that the indicator is purely technical, and fundamental factors such as economic announcements and political events can cause the markets to make sharp price jumps. Technical traders always keep an eye on the economic calendar to avoid opening positions just before volatile market conditions. Fractal Forex analysis can be highly useful for scalpers. Scalpers are intraday traders trying to catch price swings. However, fractals can have very little usage for news and fundamental traders, as well as high-frequency traders. Using many indicators simultaneously might seem tempting for novice traders. However, this might be counterproductive. When using lots of indicators, traders are often unable to make trading decisions. When one indicator signals to buy, and the other signals to sell, decision-making becomes complicated. In trading, this is called analysis paralysis. And therefore, if you're planning to use fractals, it's important to use them based on the market conditions.
Trading strategies using Fractals indicator
Bill Williams developed the concept of fractals as a part of his Chaos Theory in trading. The main purpose of Fractals is to identify potential trend reversals, as they are formed when five consecutive bars display a specific pattern.
Fractal Breakout Strategy
Identifying support and resistance levels using fractals is much more objective and ensures traders detect exact levels. Traders can look for breakouts of these levels as a signal for entering a trade in the direction of a breakout. Fractals can help not only detect the breakout but also confirm the validity of the breakout. To increase the success rate, it is recommended to wait for the retesting for the recently broken level and follow the price when it reverses back to the direction of the breakout. ZigZag indicator can also be used as a companion indicator to see breakouts more clearly.
Trend Reversal Method
Many traders use fractals to identify potential reversal points in already-established trends. A series of higher highs and higher lows can be disrupted by a fractal pattern, signaling the possible end of an uptrend. This can be used for anticipating reversals and catching opposite movements. Traders should also look for confirmation from other technical indicators before entering the trade right from the first signal. It is always better to wait for the retesting and only then continue trading with the reversal.
Alligator Indicator Approach
Bill Williams has also developed another popular indicator, Alligator, that incorporates fractals. The indicator consists of three moving averages (called Jaws, Teeth, and Lips), and Fractals help to determine the alignment of the market. So fractals can be considered as a filtering indicator in Alligator. Traders can look for crossovers and divergences between these moving averages to identify potential trend changes and open trading positions accordingly.
Fractal Channels
Traders can also use Fractals for drawing trend lines that form channels. By looking at key support and resistance levels created using Fractal-based channels, traders can buy near the lower channel and sell in proximity to the upper channel. Using other indicators like moving averages can act as a filter for this channel strategy.
Fractals and Fibonacci Retracements
Fractals can make it much easier and clearer to use Fibonacci Retracements correctly. By identifying the upper and lower fractals, traders can draw Fibonacci Retracement and identify potential levels for buying and selling. When a fractal pattern aligns with a Fibonacci level, it can provide a stronger signal for a potential reversal.