How to Use the High Low indicator in MT4
The most evident way to use MT4 daily or weekly high low indicator is to identify the potential
support and resistance levels. Why are support and resistance levels and areas important? The answer is simple, prices move from significant levels to significant levels, and professional traders aim to place orders when the price is close to support or resistance to get maximum profits. These levels are critical for finding entries, in addition, they come in very handy when deciding where to place stop loss orders. The support and resistance levels help traders better plan their trades and calculate
risk-to-reward ratios.
The process mostly boils down to a few parts:
- Identify the short-term support
- Identify the short-term resistance
- Confirm the trend through market news
Identifying the short-term support and resistance level can be very helpful both for scalpers and day traders. The basic possible tactic here would be to buy the currency pair that is close to the support level and sell the ones that are near the resistance. Obviously, most likely the market will eventually break out, but for such a short timeframe this might be helpful. The idea of trading using the high low indicator in MT4 is to apply this indicator when the price is in range.
Keep in mind that there are various timeframes in trading. Depending on which format you are using, the indicator will send you different signals. In general, the higher the timeframe, the more accurate the indicator is. The reason is simple, lower timeframes such as 5-1 min candlestick charts have a high amount of market noise.
Session high low indicator mt4 traders are using is one of the high low indicator types that incorporate trading ranges based on each trading session. The Forex market is decentralized, which means that there are various markets where you can buy or sell currencies. There are four major markets: London, New York, Sydney, and Tokyo. London and New York sessions are the most liquid. Session high low indicator emphasizes the most active trading sessions when displaying support and resistance levels. The High Low indicator can be used for various purposes to increase the accuracy of trading decision-making. Here are some more ideas on how to use HL indicator to maximize profits:
Importance of high low indicator for breakout strategy
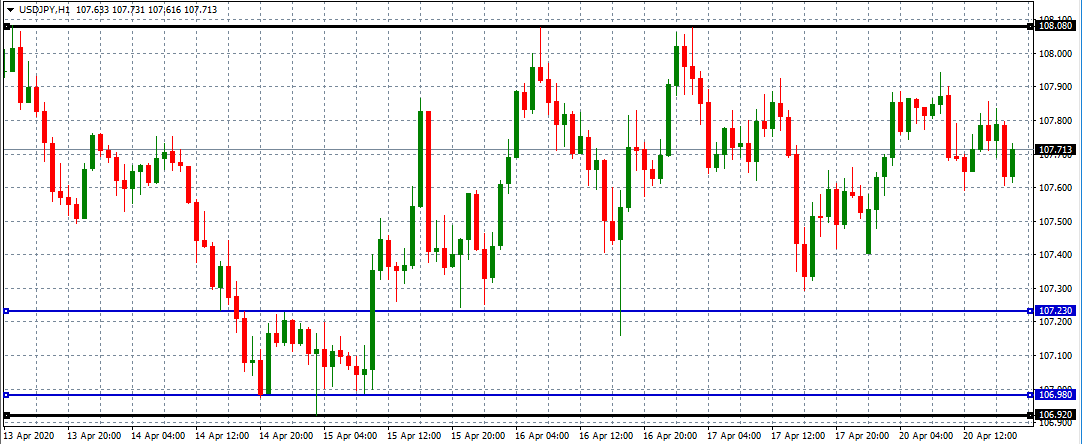
The high low indicator is also widely used to formulate breakout strategies. Let us take a look at this hourly USD/JPY chart:

Two blue horizontal lines signify the MT4 session high low indicator for April 14th, 2020. A set of two black lines represents the weekly high and low of this pair.
On that day, April 14th USD/JPY fluctuated significantly but remained within the range between 106.98 to 107.23. During the next session the pair tried to break the support levels below, however, as we can see spikes into the area below have been rejected several times. Eventually, the tide turned and as we can see, the one large green line pierced the resistance level near 107.
So the pair broke out of the range and rallied all the way up to 108.08. Interestingly enough, that 107.23 mark which offered resistance during the 14th of April, later became a support level, rejecting various downward spikes into that level. If a trader opened a long USD/JPY position when the previous day’s high was breached, then he or she would have benefited from this upward trend and earned a nice payout.
Basically, this is the essence of this strategy. Using those two flat lines as well as individual MT4 candle highs and lows as guidelines for identifying support and resistance levels, and also spotting potential breakouts when the marker breaches those points.
This type of analysis is not only helpful for the day traders, but can also be helpful with swing trade strategies.
Trend analysis with high low indicator for Forex trading
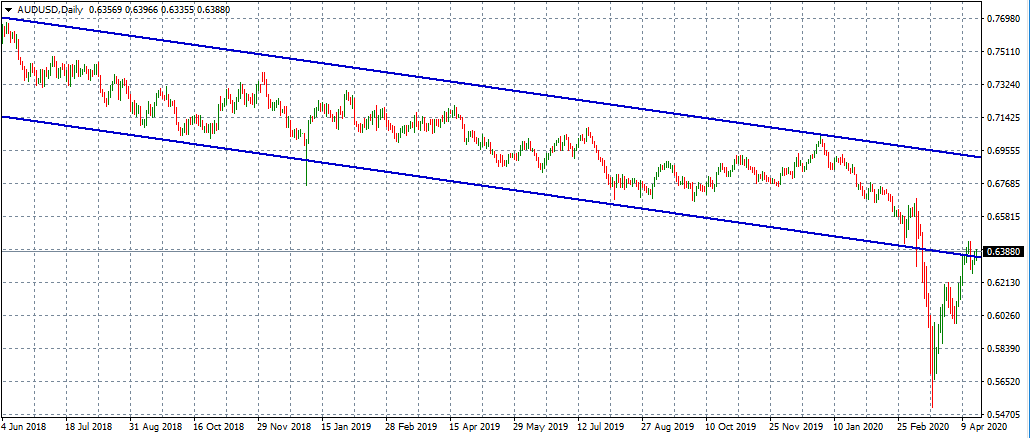
One interesting thing to notice about the high low indicator is that it is not only useful for the short-term, range trading, but also for trend identification as well. This can be especially useful for long term analysis. To illustrate this let us take a look at this daily AUD/USD chart:

As we can see from the above, this pair was engaged in a very clear downward trend for more than 20 months. Generally speaking, during this period, both weekly highs and lows were getting lower. So instead of drawing MT4 swing high low indicator, this chart has two blue lines which represent the downward channel, which remained unbroken for such a surprisingly long period of time.
The AUD/USD pair eventually broke down during February 2020, however, this was rather short-lived and by the beginning of April, it was back into the channel. The Australian dollar might continue its long term decline against the US dollar unless it breaks above the upper blue line and overcomes the resistance.
So as we can see, traders can also utilize MT4 weekly or daily higher highs or lower lows as an indicator for the formation of an uptrend or downtrend respectively. This is well illustrated in the chart above: during the beginning of this period, the Australian dollar’s weekly highs have reached 0.77 level. However, as the trend progressed, those highs were getting lower. Eventually, AUD/USD struggled to even overcome 0.6500 marks, and even nowadays the pair has a hard time reaching that level.
So how can a trader conduct analysis by how low an indicator is? Well, essentially he or she can compare daily or weekly highs and lows to previous periods and if there is a clear upward or downward bias, then there might be a reasonable chance of trend formation.
Limitations of high low indicator
As we have seen, the high low indicator can be very handy, at least for three types of analysis. However, just like any other measure, it does not have a 100% accurate predicting power on its own. There are many scenarios where using only this indicator can be very misleading and can eventually lead to
wrong conclusions and some losses.
Returning to our last chart, as we can see from February 2020, AUD/USD broke down, in fact, this move was so strong that it overcame all previous lows and consequently pierced all possible support levels.
If a trader only used a high low indicator for analysis and ignored all other technical and fundamental indicators, he or she might have concluded that the downtrend was just getting stronger. And possibly would have opened a short AUD/USD position. As we can see from this chart, this would not be the best idea, since, during March 2020, the Australian Dollar recovered from the recent collapse and nowadays, it trades well above 0.63 level.
Relying on only high low indicators can be dangerous on scalpers and day traders as well. Buying daily lows and selling daily highs might work for them several times, however, it is far from guaranteed. Returning to our second, USD/JPY chart, we can see that if a trader used blue lines (high and low of April 14th) he or she might have succeeded for short hours. However, eventually the pair broke out of this range and pierced the resistance level, rising significantly. Therefore, it's best to use the high and low indicator mt4 in combination with various other indicators and strategies. It's important to note that usage of too many indicators can also be very negative. The reason is simple, when you are using too many indicators and variables to make a decision, decision-making will become tremendously difficult. When one indicator tells you to buy and the other one tells you to sell, you will most likely avoid placing an order. This phenomenon is known as analysis paralysis.
Range expansion strategies
Traders can employ the High Low indicator to detect the periods with low volatility that are usually followed by breakout opportunities. Awaiting price consolidation in the narrow range is the best way to achieve this. The High Low lines provide good visual guidance for detecting the narrowest ranges on the market. Once a breakout occurs, traders can enter the direction of the breakout and set stops at the proximity of lines as well.
For example, if the price has been trading within a narrow range and suddenly breaks above the high, it may signal a bullish breakout. Now, there are two ways of entering during breakouts, aggressive and conservative. Aggressive would be to jump in the trend direction right away, while a more conservative approach is to wait for a retest on the high level and then enter. The second option is better to filter fakeouts, meaning the breakouts that retreat right away. The opposite would be true for the sell trades, where stops are placed above the line. It is always a must to have a well-thought-out risk management strategy in place when trading high-risk setups like breakouts.
Intraday Reversal Strategies
The High Low indicator can be used in various trading strategies applicable for both ranging and trending markets. One of the good trading methods is to use the HL indicator for awaiting the reversals from weekly or daily highs and lows. Traders can closely monitor situations where the price approaches the daily or weekly low but fails to break below it. Traders can wait for the price to test these lows and then reverse. The best way is always to await the test and when the price reverses follow it upward. It is possible to scalp these situations for quick profits or use medium-term swing trading methods for capitalizing fully.
Every time the price approaches upper or lower lines, traders should be cautious and monitor price action closely. It may be a potential breakout or reversal trade.
So, the high Low indicator can be used for both breakouts and reversals when placed in experienced hands.
Trend confirmation with multiple timeframes
Enhancing the trend analysis using the HL indicator is never a bad idea. Multiple timeframes will offer even more clarity about the current situation in the market. This includes comparing highs and lows on different timeframes to confirm the overall trend direction. For example, if the daily highs and lows consistently show an uptrend, while the weekly highs and lows confirm the same, it provides a stronger indication for an ongoing bullish trend. Conversely, if the daily and weekly highs and lows show a downward trend, then this can be a strong signal for looking for short trades. In any case, it is important to thoroughly test any strategy before applying them to live markets. A demo account can be a great help for developing profitable strategies using the High Low indicator. It may not be the best indicator out there, but still offers decent insight into market dynamics.