The best timeframes for trading inverted hammer
Different traders prefer different timeframes. Seasoned traders typically use daily and 4-hour charts to clear market noise and detect the best entries. As a result, trading inverted hammers bears the best results and gives the highest statistical edge on these timeframes. Despite this, many traders love using intraday timeframes such as 5-minute, 15-minute and hourly. The inverted hammer formation is also useful on these timeframes for gaining confidence and confirming bullish setups. However, using it as a standalone indicator will prove incorrect and traders must use other tools as well to ensure a higher win rate and better performance. Lower timeframes tend to generate more signals than daily and 4-hour and this typically ends up in more false signals. Therefore, traders should use tighter stop-loss orders and smaller position sizes to limit losses and cut them as early as possible.
Some traders who use swing trading strategies might also use weekly and monthly charts but they are mostly investors. On those timeframes, the pattern can also be very powerful when used with fundamental bias. In this case, traders use the inverted hammer to spot long-term reversals.
In the end, it all depends on the trader’s reference and trading style. If higher timeframes are selected, then false signals are fewer, while lower timeframes have more false signals, and traders need to deploy other confirmation methods to ensure higher trading accuracy and better results.
Inverted hammer examples - real-world cases
In our inverted hammer explanation, we have covered the main criteria for the candle and setup. However, finding one on the chart is not an easy task for inexperienced traders. Let’s pick some examples across different markets to make it easier for readers to understand and spot high-quality inverted hammers.
NASDAQ

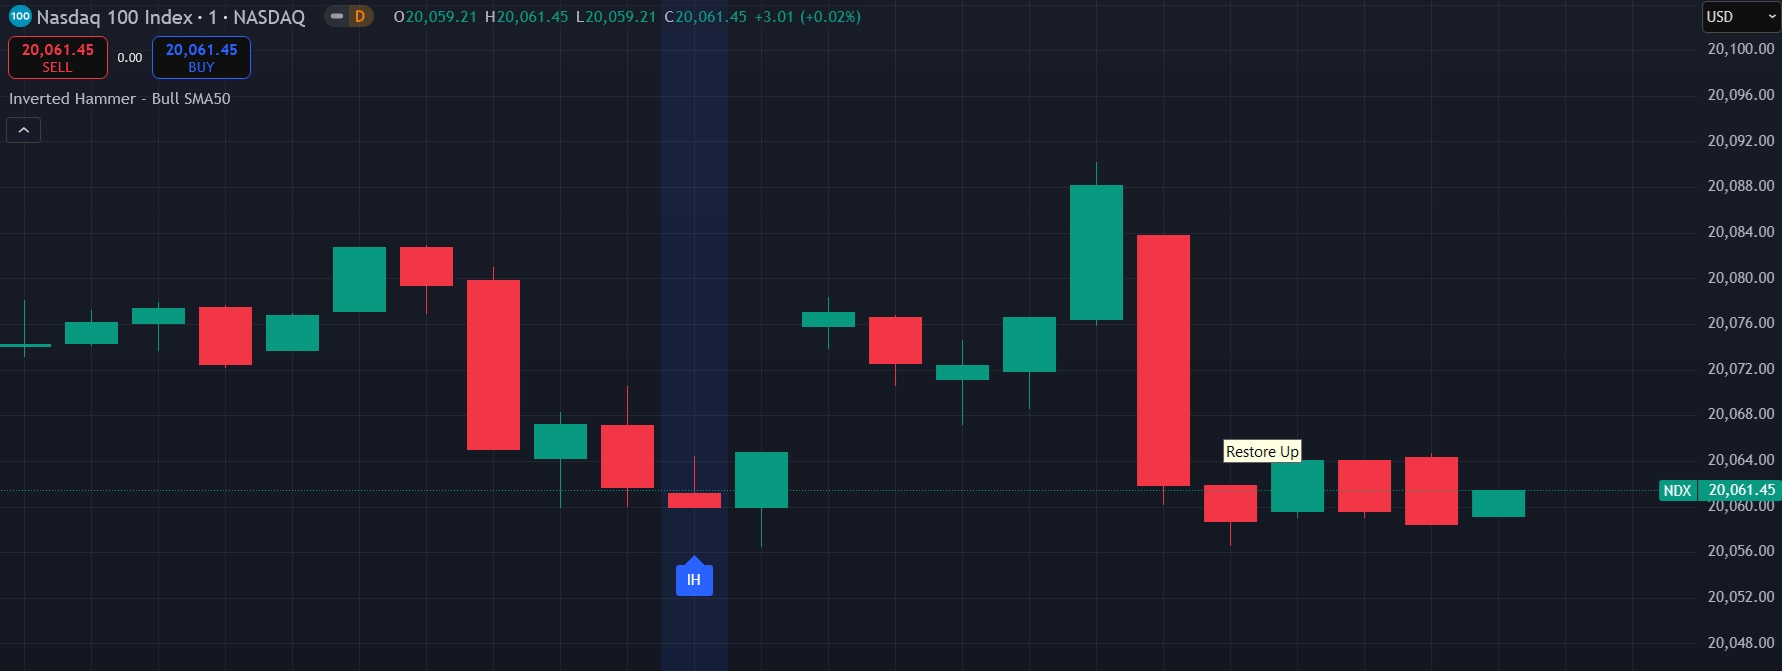
Very good inverted hammer formation on this NASDAQ 1-minute chart that led to the bullish gap and upward spike. Although the price pulled back later to the inverted hammer candle levels, it initially covered some nice distance upward.
Bitcoin

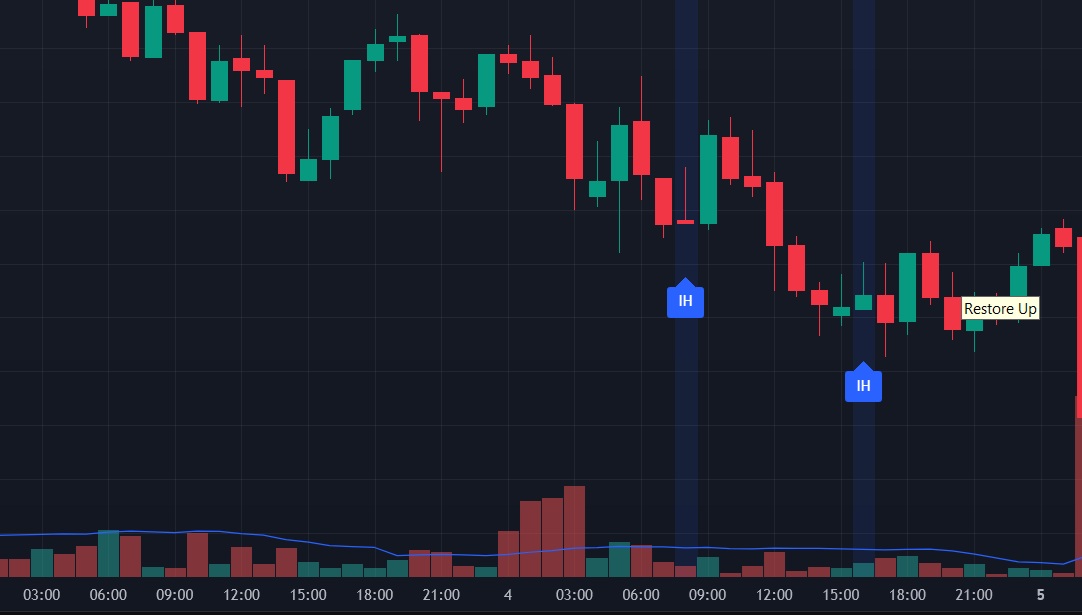
As we can see on this 1-hour Bitcoin chart, there were 2 false inverted hammer signals, which would be easily filtered using the volume. Since volume started to decline even though the price showed bullish candles, seasoned traders would disregard these setups as they were not supported by volume.
Forex (EUR/USD)

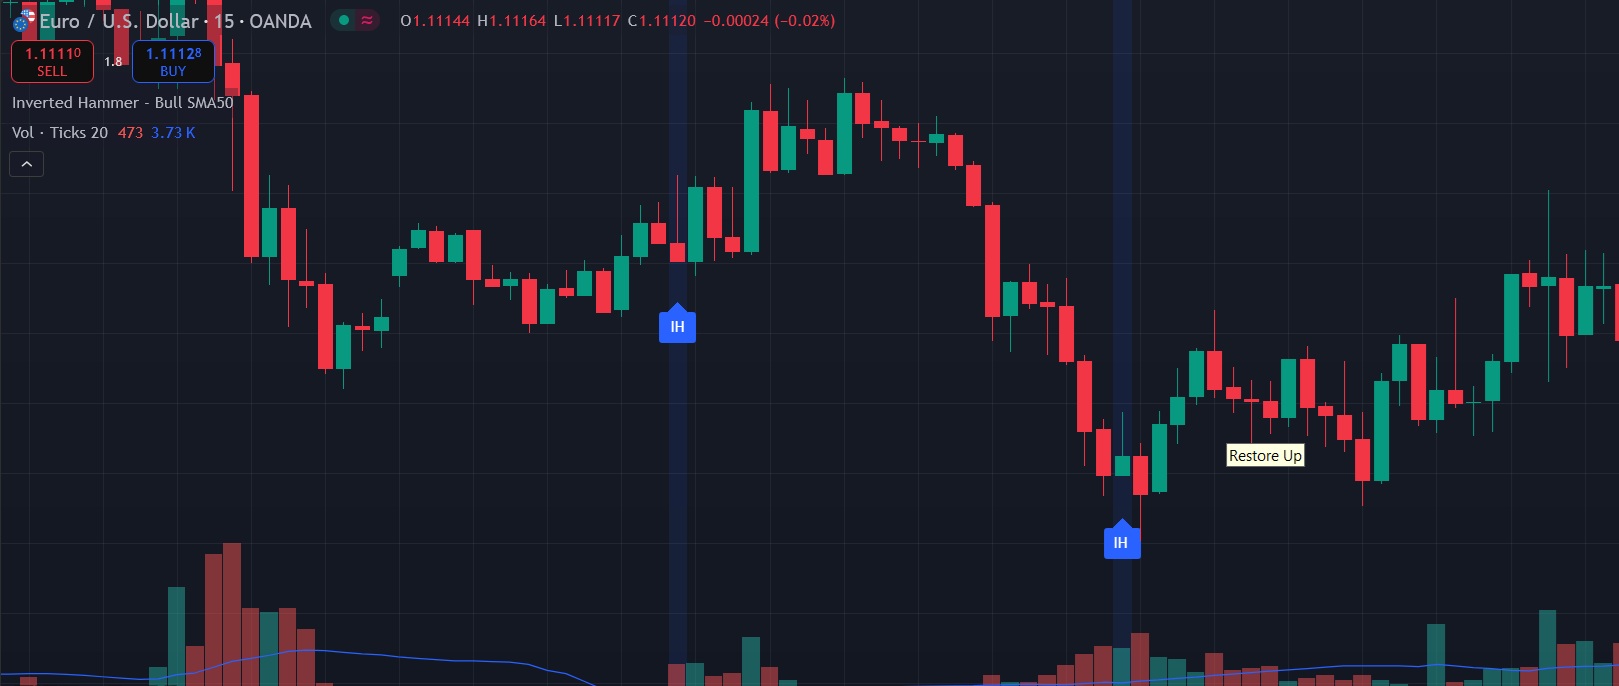
These setups on the EUR/USD FX major pair showed two inverted hammers that would work and volume also agreed with the pattern being above its 20-period moving average.
Overall, the inverted hammer can be found in all asset classes across different timeframes and when used with additional filters, it can produce valid trading signals.
Trading inverted hammer - the best practices
Let's overview the essential rules to make it easier for beginners to employ inverted hammers in their trading.
Entry rules
To initialize trading with an inverted hammer, you need to have strictly defined entry rules. It must be objective and devoid of subjective criteria and intuition. The most preferred entry rule is to buy at the close above the inverted hammer’s high. This is also known as a close-break entry. When the price breaks the hammer’s highest price point and closes, you can enter a long position.
An alternative is to enter on the break of the high for more aggressive trading, but the win rate will be lower.
Stop-loss and position sizing
Stop-loss is mandatory, no matter the accuracy of your trading setups. In our case, placing the stop-loss order just below the pattern’s low or inverted hammer candle’s low could be a good idea. Traders typically place it 2-3 pips below the low of the candle.
Position sizing is critical to ensure you can take losses and continue trading for profitable setups. The most popular approach is to risk no more than 1-2% of your trading account balance on any single trade.
Risk-reward ratio
Risk-reward ratio simply means how much you risk in comparison to potential profits. If your stop-loss is 10 pips away and you want to target 20 pips, then your risk-reward is 1:2, which is a very healthy ratio. Surely, it depends on the stop-loss distance and your target and this ratio may vary from trader to trader. A 1:2 risk-reward ratio is a perfect method to grow your account over time while not getting too many losing streaks which translates into less emotional stress in your trading.
Confirmation techniques
As with any other setup and indicator, using an inverted hammer as a standalone strategy will not bear profits. Traders generally use confirmation techniques such as volume, RSI overbought and oversold levels, MACD cross, and so on.
Higher than average volume typically indicates more buyers are joining the market. RSI indicator can also provide some additional confirmation to confluence when RSI is below 30. MACD adds momentum confirmation. Traders can choose any of those or add their preferred indicators and tools to confirm the inverted hammer setups.
Common mistakes and how to avoid them
The inverted hammer is a powerful pattern when traded wisely, but beginners tend to make mistakes that reduce their chances of generating consistent profits. Here are some common mistakes to avoid when trading inverted hammer:
- Choppy markets - In sideways and choppy markets where the price can not decide the main direction and bounce back and forth, almost all trend trading setups fail, including an inverted hammer. This is why it should only be used after a trend.
- Confirmations - An inverted hammer is more profitable when confirmed with other indicators and tools or when used as an additional confirmation.
- Over-leveraged trading - Risk management and proper position sizing are key in financial trading and many beginners tend to make a mistake when they trade with extremely high leverage.
By avoiding these common pitfalls, even the beginner trader can generate profits using the inverted hammer pattern.