What is the inverted hammer?

Candlestick patterns remain a popular form of technical analysis because they simplify complex market psychology into simple visual cues. Unlike technical indicators, which are often laggy, candlesticks reflect real-time changes in sentiment and directly show the battle between bulls and bears. For day traders, candlestick patterns such as inverted hammers can offer clear entry and exit signals which can be translated into profits. In this guide, we will dissect and explain inverted hammers, which is an upside-down version of the classic hammer. An inverted hammer typically signals a potential bullish reversal after a downtrend. Although it appears on almost all major asset classes, its reliability varies by market and timeframe and we will also provide the best markets for this pattern and the best indicators and tools to confirm signals produced by inverted hammers.

Start Trading in 10 Minutes

Apply everything you’ve learnt on a real trading account with up to 1:2000 leverage, negative balance protection and outstanding support.
Get Started

Formation of an Inverted Hammer

The inverted hammer is a one-bar, bullish reversal pattern. It simply consists of one candle with a small real body (the distance between opening and closing prices on a candle) at the lower end of its range. It has a longer upper shadow (wick) at least twice the body’s length, with little or no shadow. Visually, it resembles an upside-down hammer, usually indicating that buyers briefly drove prices higher but sellers pushed them back down toward the open. Inverted hammers are used by traders as a part of their candlestick analysis, which is basically a technical analysis of the price action. Hammer indicates that the price might start going up, making it a powerful bullish signal. 

Inverted hammer vs. hammer vs. shooting star

Traders love to name different candlestick patterns so they are easier to recognize, but in the case of hammers, there are several names assigned that are important to understand. Here are the different types of hammers:

  • Hammer (pin bar) - Often forms after a downtrend, long lower shadow, and a small body at the top.
  • Inverted hammer - Also forms after a downtrend, has a longer upper shadow, and a small body at the bottom.
  • Shooting star (bearish pin bar) - Has an identical shape to an inverted hammer but appears after an uptrend, signaling a potential bearish reversal. 

During an inverted hammer session, initial buyer strength drives the price up, creating the long wick. Then sellers regain control by the close. The pattern is often followed by bullish candles, meaning bulls are gaining momentum, overpowering bears. 

Formation of an inverted hammer

There are several criteria to detect the inverted hammer and it is not only about the candle itself. There should be a prior downtrend and an inverted hammer candle must appear after at least two consecutive loser closes, which confirms a bearish swing. Another important aspect is the small body, meaning the open and close are close together, located at the lower end of the candle. 

formation-of-an-inverted-hammer.jpg

Little to no wick below the body is yet another crucial criterion for detecting a true inverted hammer candle. These strict criteria ensure the trader catches only the strongest inverted hammers, to ensure the pattern reflects a meaningful shift from sellers to buyers. 

Long upper shadow of the inverted hammer

The long upper shadow is the defining feature of inverted hammer candles. It illustrates important information: buyers tested higher price levels but lacked follow-through to hold gains, and sellers pushed the price back down. This failed rally is psychologically very important: it shows buyers are starting to step in, even though they have not fully taken control of the price. When the next candle closes above the inverted hammer’s high, it confirms that buyers became stronger than sellers, making the pattern a reliable entry signal. Inverted hammer long upper shadow being taken out by buyers indicates strong buyer presence and gives confidence to traders to enter long positions when confirmed with other indicators as well. 

Variations of the inverted hammer pattern

As we have mentioned there are several variations of hammer candles, which are similar visually but depending on where and when they appear, they get different names from traders. Some aspects like body length and body location are very important in detecting an inverted hammer, but some are not that important for the candle to be a hammer:

  • Body color irrelevant - Whether the inverted hammer closes up (green color) or down (red), it does not materially affect its bullish bias. Traders should instead focus on the wick and context of the market.
  • Variation in shadow length - Some patterns feature longer upper wicks which sometimes can be 3x or more of the body, indicating stronger initial buying, while others are shorter. However, they still provide a strong signal.
  • Body size variation - A very small body (doji-like) suggests instead indecision and a slightly larger body reflects a more balanced battle. No, doji is not specifically bullish so traders have to be careful. 

To compare inverted hammer, shooting star, and hanging man, below is a table:

Location 

Upper shadow

Lower shadow

Signal 

Inverted hammer

After downtrend

Long (more than 2x the body)

Minimal 

Bullish reversal

Shooting star

After uptrend

Long (more than 2x the body)

Minimal

Bearish reversal

Hanging man

After uptrend

minimal

Long (2x the body)

Bearish reversal

This comparison is very useful to differentiate between different patterns which are identical in shape but indicate opposite signals. It all depends on the prior trend direction.

Inverted hammer candlestick pattern in different markets

The inverted hammer is not market-specific and can be found in all markets including Forex, stocks, cryptos, ETFs, indices, and more. However, candlestick patterns are more effective in some markets and less profitable in others. Let’s briefly overview inverted hammer examples in each of the popular asset classes and their effectiveness for generating consistent profits. 

Stocks

When it comes to candle patterns including the inverted hammer formation, stocks are the most popular markets. The pattern works well when combined with other indicators and the overall market context and has shown profitable results in many scenarios. Entries are generally made when the price closes above the inverted hammer’s high and filtered by RSI oversold conditions (<30). Inverted hammer examples in stock markets include Apple and Microsoft stocks where the pattern was effective during early-2020 market lows, where follow-through rallies produced 3-5% gains within two weeks. Stock markets are generally driven by fundamental bias and are centralized which makes them more prone to technical analysis, unlike other markets in this list.

Forex

Forex is a decentralized market where a multitude of market makers provide pricing data to traders, making it extremely difficult to use market sentiment and other analysis tools that are effective in stocks. As a result, the inverted hammer formation must be used with other confirmation tools and should be tested carefully as this market is known to disregard candlestick patterns. It is best to use an inverted hammer and other candle formations as an additional confirmation to your trading strategy. 

Crypto 

Known for large price swings and extreme volatility, cryptos are a popular asset class for many retail traders. Because of this higher volatility, the spreads are also very high and even get extreme when large price swings occur. As a result, traders need to use candlestick patterns and all other strategies with rigorous risk control. Using an inverted hammer as a standalone without combining several indicators will result in losses. Instead, it should be used as an addition to your strategy for confirming entries. 

Start Trading in 10 Minutes

Apply everything you’ve learnt on a real trading account with up to 1:2000 leverage, negative balance protection and outstanding support.
Get Started

The best timeframes for trading inverted hammer

Different traders prefer different timeframes. Seasoned traders typically use daily and 4-hour charts to clear market noise and detect the best entries. As a result, trading inverted hammers bears the best results and gives the highest statistical edge on these timeframes. Despite this, many traders love using intraday timeframes such as 5-minute, 15-minute and hourly. The inverted hammer formation is also useful on these timeframes for gaining confidence and confirming bullish setups. However, using it as a standalone indicator will prove incorrect and traders must use other tools as well to ensure a higher win rate and better performance. Lower timeframes tend to generate more signals than daily and 4-hour and this typically ends up in more false signals. Therefore, traders should use tighter stop-loss orders and smaller position sizes to limit losses and cut them as early as possible. 

Some traders who use swing trading strategies might also use weekly and monthly charts but they are mostly investors. On those timeframes, the pattern can also be very powerful when used with fundamental bias. In this case, traders use the inverted hammer to spot long-term reversals.

In the end, it all depends on the trader’s reference and trading style. If higher timeframes are selected, then false signals are fewer, while lower timeframes have more false signals, and traders need to deploy other confirmation methods to ensure higher trading accuracy and better results. 

Inverted hammer examples - real-world cases

In our inverted hammer explanation, we have covered the main criteria for the candle and setup. However, finding one on the chart is not an easy task for inexperienced traders. Let’s pick some examples across different markets to make it easier for readers to understand and spot high-quality inverted hammers. 

NASDAQ
nasdaq-inverted-hammer-formation.jpg
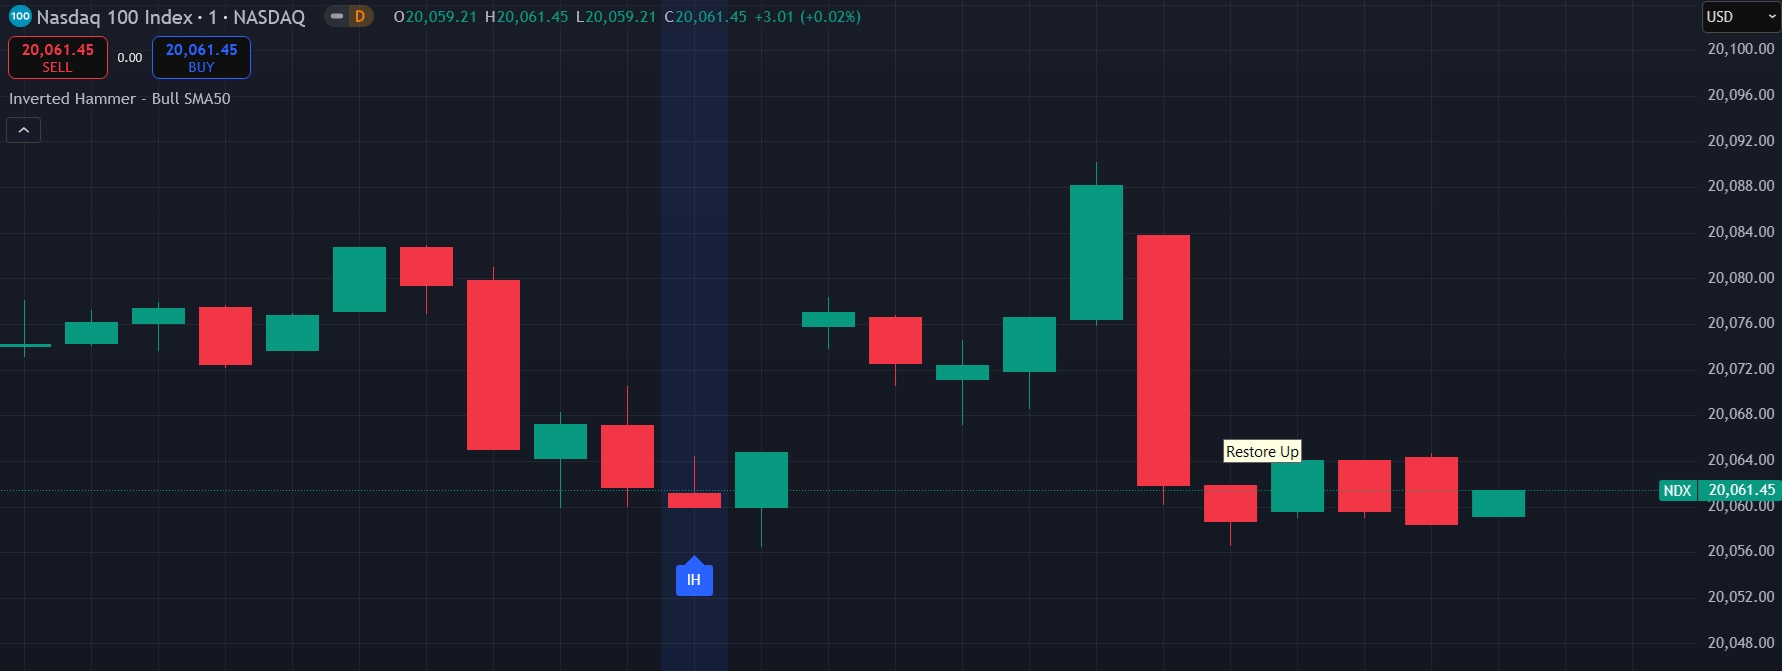
Very good inverted hammer formation on this NASDAQ 1-minute chart that led to the bullish gap and upward spike. Although the price pulled back later to the inverted hammer candle levels, it initially covered some nice distance upward.

Bitcoin
bitcoin-inverted-hammer-formation.jpg
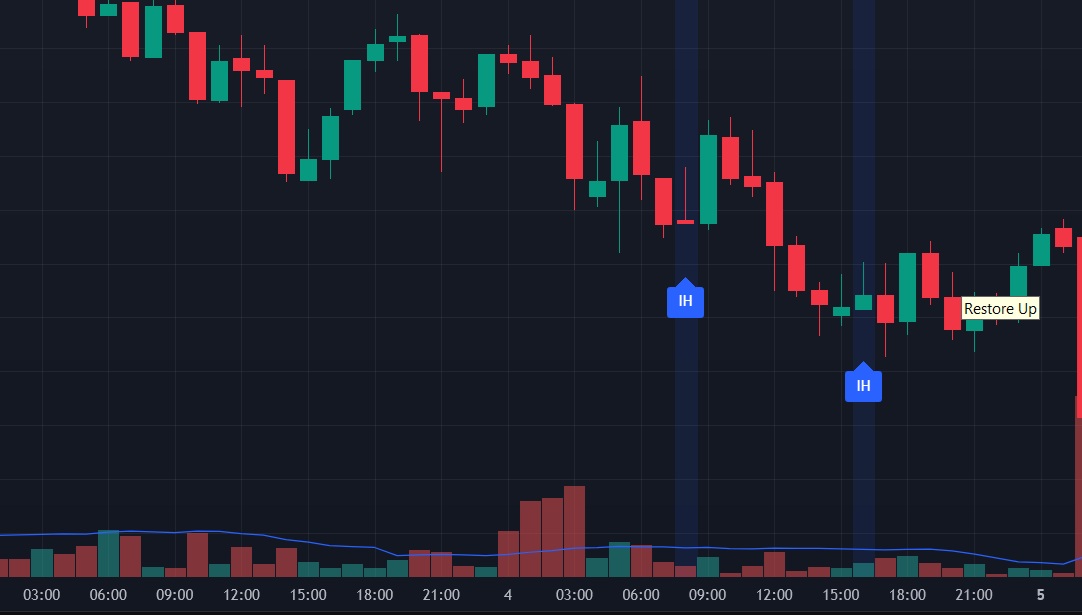
As we can see on this 1-hour Bitcoin chart, there were 2 false inverted hammer signals, which would be easily filtered using the volume. Since volume started to decline even though the price showed bullish candles, seasoned traders would disregard these setups as they were not supported by volume.

Forex (EUR/USD)
eurusd-inverted-hammer-formation.jpg
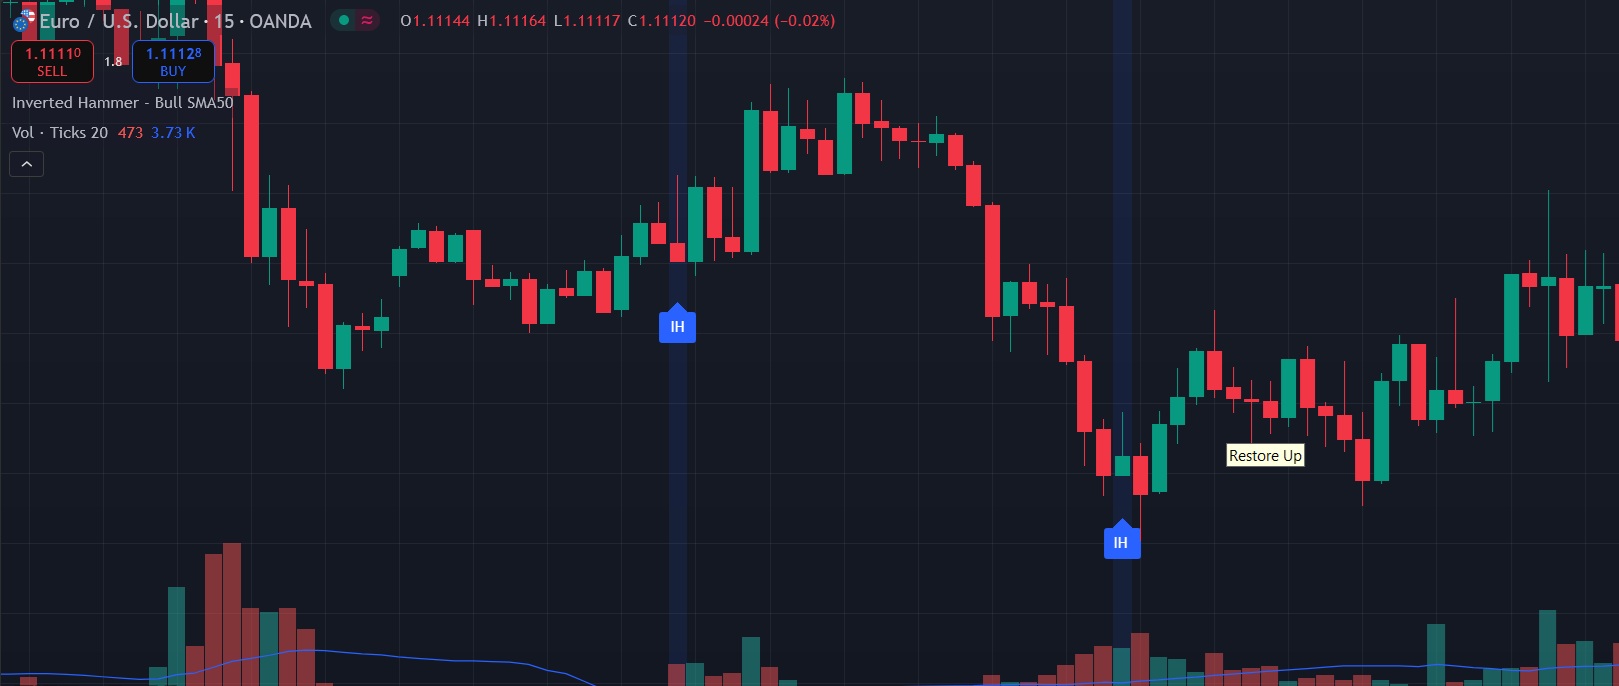
These setups on the EUR/USD FX major pair showed two inverted hammers that would work and volume also agreed with the pattern being above its 20-period moving average. 

Overall, the inverted hammer can be found in all asset classes across different timeframes and when used with additional filters, it can produce valid trading signals. 

Trading inverted hammer - the best practices

Let's overview the essential rules to make it easier for beginners to employ inverted hammers in their trading. 

Entry rules

To initialize trading with an inverted hammer, you need to have strictly defined entry rules. It must be objective and devoid of subjective criteria and intuition. The most preferred entry rule is to buy at the close above the inverted hammer’s high. This is also known as a close-break entry. When the price breaks the hammer’s highest price point and closes, you can enter a long position. 

An alternative is to enter on the break of the high for more aggressive trading, but the win rate will be lower. 

Stop-loss and position sizing

Stop-loss is mandatory, no matter the accuracy of your trading setups. In our case, placing the stop-loss order just below the pattern’s low or inverted hammer candle’s low could be a good idea. Traders typically place it 2-3 pips below the low of the candle. 

Position sizing is critical to ensure you can take losses and continue trading for profitable setups. The most popular approach is to risk no more than 1-2% of your trading account balance on any single trade. 

Risk-reward ratio

Risk-reward ratio simply means how much you risk in comparison to potential profits. If your stop-loss is 10 pips away and you want to target 20 pips, then your risk-reward is 1:2, which is a very healthy ratio. Surely, it depends on the stop-loss distance and your target and this ratio may vary from trader to trader. A 1:2 risk-reward ratio is a perfect method to grow your account over time while not getting too many losing streaks which translates into less emotional stress in your trading. 

Confirmation techniques

As with any other setup and indicator, using an inverted hammer as a standalone strategy will not bear profits. Traders generally use confirmation techniques such as volume, RSI overbought and oversold levels, MACD cross, and so on. 

Higher than average volume typically indicates more buyers are joining the market. RSI indicator can also provide some additional confirmation to confluence when RSI is below 30. MACD adds momentum confirmation. Traders can choose any of those or add their preferred indicators and tools to confirm the inverted hammer setups. 

Common mistakes and how to avoid them

The inverted hammer is a powerful pattern when traded wisely, but beginners tend to make mistakes that reduce their chances of generating consistent profits. Here are some common mistakes to avoid when trading inverted hammer:

  • Choppy markets - In sideways and choppy markets where the price can not decide the main direction and bounce back and forth, almost all trend trading setups fail, including an inverted hammer. This is why it should only be used after a trend. 
  • Confirmations - An inverted hammer is more profitable when confirmed with other indicators and tools or when used as an additional confirmation. 
  • Over-leveraged trading - Risk management and proper position sizing are key in financial trading and many beginners tend to make a mistake when they trade with extremely high leverage. 

By avoiding these common pitfalls, even the beginner trader can generate profits using the inverted hammer pattern. 

Axiory uses cookies to improve your browsing experience. You can click Accept or continue browsing to consent to cookies usage. Please read our Cookie Policy to learn more.