The best Forex indicators MT5 platform offers
MetaTrader 5 (MT5), alongside its predecessor MT4, has become an incremental aspect of Forex trading. Unlike the previous version, MT5 had much more space for lots of different instruments. MetaTrader 5 is known as a multi-asset trading platform as it offers access to various asset classes such as Stocks, Forex, Indices, Bonds, Commodities, and Crypto. Meanwhile, MT4 is consumed mainly for trading Forex pairs. MT5 was released in 2010 and became highly popular right away. The popularity only grew with the passing years and as a result, you can find many trading algorithms and indicators developed for the platform.
If you are looking for accurate MT5 indicators, please note that there are various market conditions. Some indicators are built for trading ranges, while others are made for trading trends. There are indicators that work best for certain trading instruments and fail to be productive for the rest of the markets.
MetaTrader 5 indicators allow traders to do quick research on the recent price movements, detect various patterns in trends, and try to predict further occurrences. There are lots of top free MT5 indicators, both pre-installed and available to download on the internet. Meta market is an online market where you can download various algorithms and indicators that are not built-in on your platform. The best MetaTrader 5 indicators downloading won't take long, however, careful research is needed before making a decision. There are many algorithms that fail to produce any results. It's critical to avoid scams when purchasing an algorithm or an indicator.
Our pick of Forex MT5 indicators include:
- The ZigZag
- The alligator
- The Money Flow Index (MFI)
Traders use these indicators for various reasons. In this article, we will discover their functionalities together. But first, let’s see how you can toggle them within the software
How to install MT5 indicators?
As we mentioned earlier, there are many indicators already available in MetaTrader 5, and those three in our list, the ZigZag, alligator, and MFI are all pre-installed on the platform. Therefore, traders only need to turn them on to start using them.
To toggle the ZigZag indicator on, you need to go to the Insert menu in the top-left corner of the screen, choose Indicators, go down to Custom, and find ZigZag all the way to the bottom of the list. When you select it, a window will appear where you can customize the color of the lines, as well as their timeframes.
As for the alligator, you need to go to the same menu and find Bill Williams under the Indicators list. There, you need to press the Alligator indicator and then customize the settings. The MFI indicator can be found in the Volumes sub-menu, and it also allows for a certain level of customizability.
The three indicators in action
After turning the top FX indicators, MT5 becomes a price-analyzing platform. Each one of these indicators is powerful in its own way and can take the traders’ positions to the next level. Let’s see how they work
The ZigZag - one of the best trend indicators MT5 offers in our opinion
The ZigZag is one of the most basic tools in MT5 that many traders and analysts use for observing the current trends and determining when they will reverse. But this predictive nature is less intuitive than other indicators and the ZigZag is predominantly used for analyzing the already-occurred trends.

The indicator first determines the support and resistance areas on the chart. What this means is that the ZigZag indicator will find out when the buyers’ and sellers’ positions are the strongest and how they affect the price trends on the market. Then, all of this translates into the up/down swings of the trend, giving us the form of a Zig-Zag pattern.
Usually, the default value for the ZigZag indicator is 5% fluctuation. However, this tends to produce much more price swings and overcomplicates the image. That is why traders prefer a 9% fluctuation value; this way, the Zig-Zag will be a lot cleaner and will show a bigger picture of market developments.
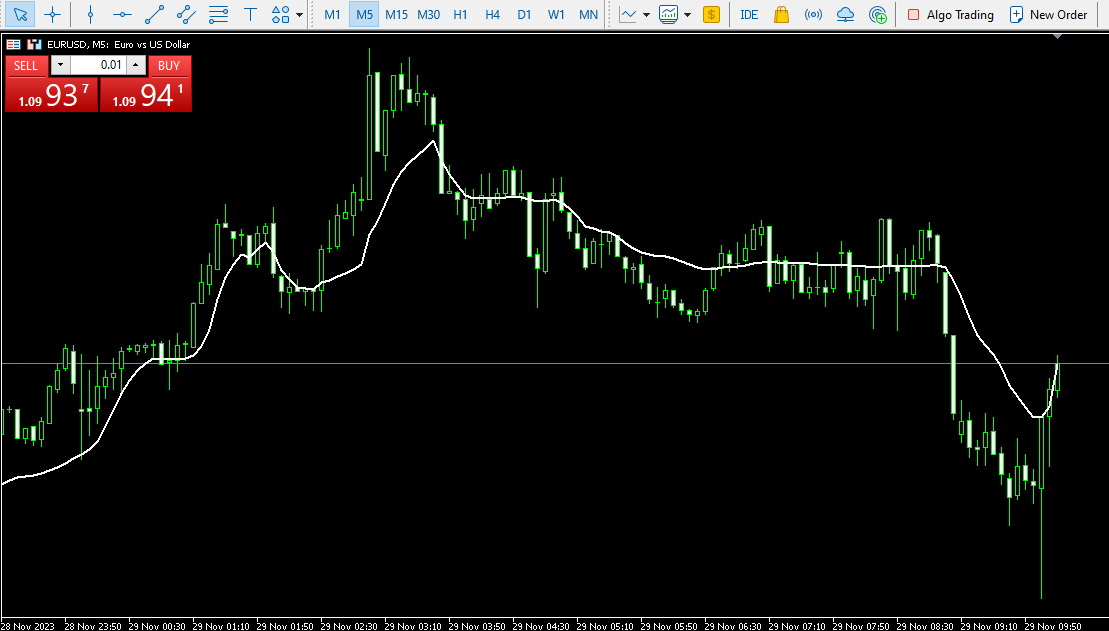
The alligator – transitions from a non-trending to a trending market
The next indicator in our list is the alligator. It was created by an American trader Bill Williams, who is known to have developed indicators with creative names, including the Awesome Oscillator Indicator and alligator.
This indicator is called the alligator because of its resemblance to the actual reptile: it has three lines that represent the jaw, teeth, and lips of the alligator.
- The jaw is a 13-period moving average that is shifted forward by 8 bars
- The teeth are an 8-day moving average that is shifted forward by 5 bars
- The lips are a 5-day moving average shifted forward by 3 bars
While there are the best MT5 indicators free download platforms offer other than the alligator, this indicator is still very special because it visualizes the transition of the market from one trend to another.

The above-mentioned moving averages are used in a combination to track the trends of the market. The idea behind the alligator is this: when the three lines are crossing one another, it is thought that the alligator is sleeping – there is no observable trend of the price going up or down.
The moment the beast wakes up, it sets out to find something to eat. And the longer it has been asleep, the hungrier the alligator is. But how does this translate into market terms? The moment of waking up can be spotted when the short-term MA (5-day) starts crossing other MAs above or below. From this time, an uptrend/downtrend starts to form. And as we said, if the non-trendy situation was present long enough, the uptrend/downtrend will be much more drastic.
Keep in mind that Moving Averages work in trending markets, but fail to produce profitable signals in ranges.
The MFI – Spotting when the market is overbought/oversold
Money Flow Index (MFI) uses volume and price action to determine potential reversal opportunities in ranges. The MFI is a technical oscillator that indicates whether the market is
overbought or oversold.
It uses a scale from 0 to 100 that rates the trends and by doing that, it assesses the market conditions. As a rule of thumb, the MFI reading below 20 suggests that the market is oversold, while the MFI reading above 80 suggests that the market is overbought.
When the indicator shows an overbought condition, it signals that reversal might happen and sells a sell signal. When markets are oversold, traders are signaled to go long. The indicator works well in ranges, however, if fails to be effective in trends. What's more, many traders use oscillators and moving averages in combination with other indicators and trading systems.

Now, this doesn’t necessarily mean that the price will definitely change its course; it just shows that the price is nearer to the highest/lowest point it has been recently. Some recommend that by changing the scale checkmarks from 20 and 80 to 10 and 90, the buy and sell signals will be more accurate because the lines that cross these points will have more chances of reversing.
Other noticeable MT5 indicators you need to know
Below, we have gathered some of the best and most popular indicators among the MT5 community of traders. So, enjoy.
The Fractal Adaptive Moving Average (FRAMA)
The Fractal Adaptive Moving Average or FRAMA is a technical analysis tool and indicator that was developed by John Ehlers. FRAMA was designed to identify trending markets and measure their strength (strength of the ongoing trend). It employs an adaptive moving average that adjusts to market volatility, making it more responsive to changing conditions when compared to standard moving averages. FRAMA measures the rate of change in the price of an asset, it is applied. It is more suited for short-term to intermediate-term time frames including 1-minute, 5-minute, 15-minute, 1-hour, 4-hour, and even daily charts. Although it was designed for stocks, it is a decent indicator for any other assets. FRAMA can be used to detect and confirm price movements and entry and exit points in trending markets.
Since FRAMA is a trend indicator, it is best to use it in conjunction with other technical indicators to increase the chances of success.
It can be downloaded from the official MQL5 store website and is free.
The next indicator in this list can be used with FRAMA to increase accuracy.
CCI Arrows Indicator
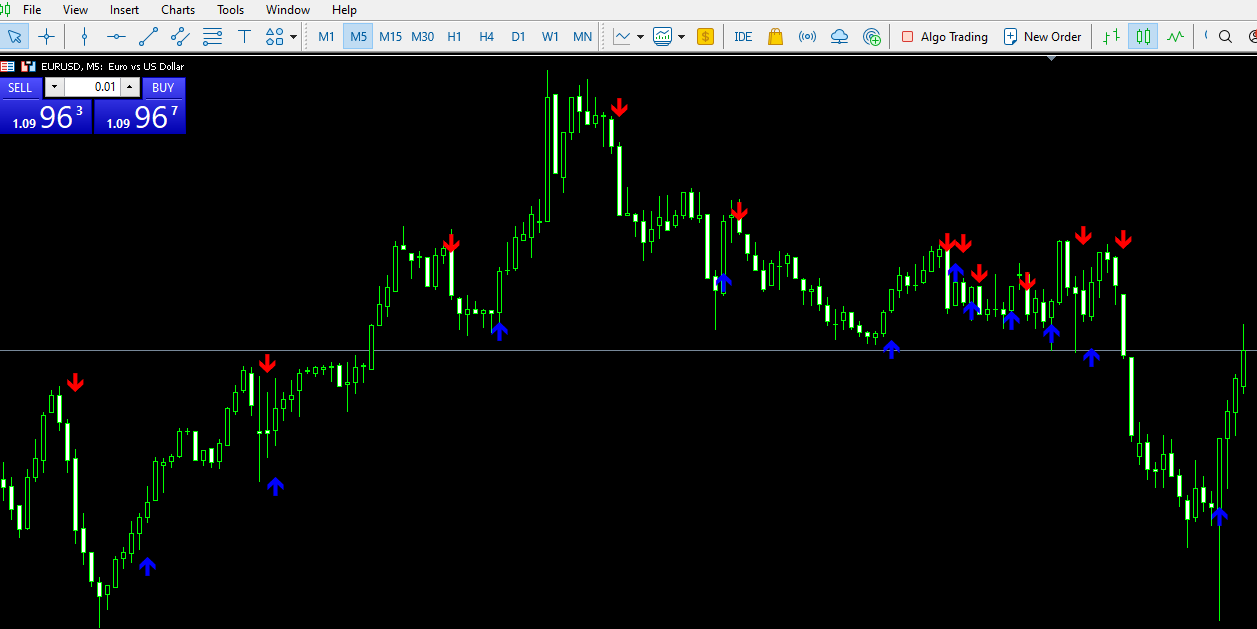
The Commodity Channel Index (CCI) is a technical indicator that compares the current price level to the average level for a user-defined period. CCI is high when prices are above average prices and decreases when prices are below average prices. The CCI Arrows take the indicator to new heights by introducing arrows that show signals based on the CCI indicator. Instead of looking at the CCI indicator, traders can just see arrows on the chart, which can be more comfortable than adding the indicator itself on the chart. The indicator places buy/sell arrows and are not repainting, which is super important to conduct proper backtesting and develop a profitable strategy. Using this indicator with any other ones in this list can bestow superpowers to any trader in catching the best setups in the market. CCI Arrows can be downloaded from the web and is free.
Bollinger Bands Moving Average Convergence Divergence (BB MACD)
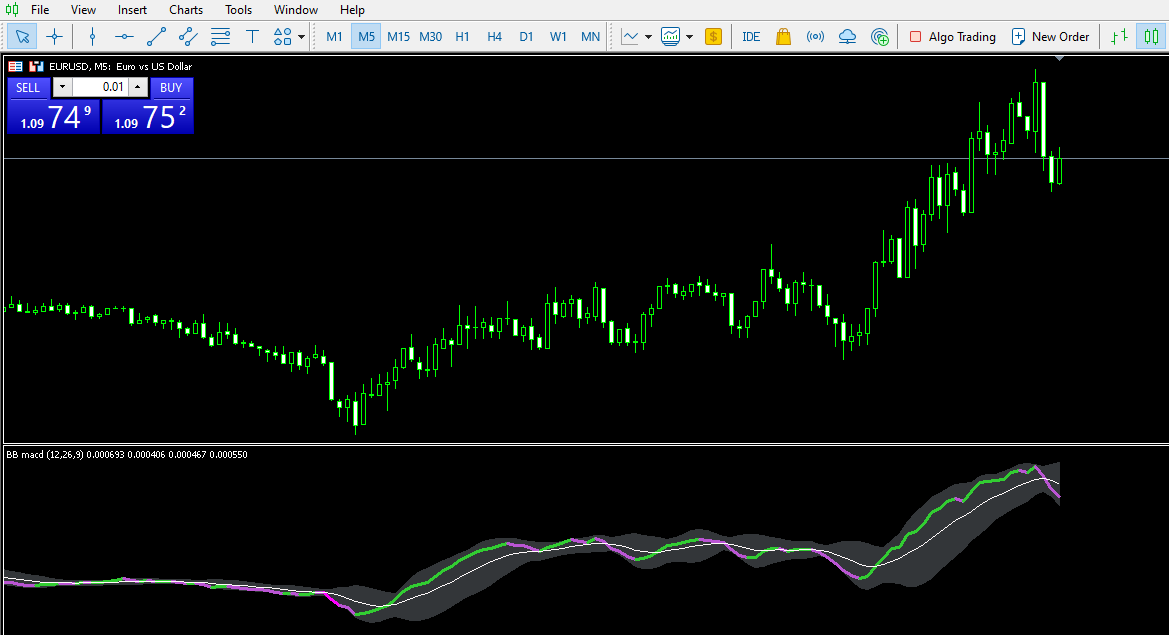
What can be better than combining two of the most popular indicators? BB MACD consists of Bollinger Bands Moving Average Convergence Divergence. It can be downloaded from the official MT5 indicators store and is free. BB MACD is similar to traditional MACD but can be more useful to identify entry levels using Bollinger Bands and MACD signal lines. While Bollinger bands are powerful and popular indicators, BB MACD allows traders to leave charts clean and see price action more easily while simultaneously watching both MACD and BB interactions more closely.
Bollinger Bands are an indicator that consists of two bands placed above and below the moving average. Depending on the volatility, these bands expand or contract. The MACD is an oscillator that indicates how two moving averages are interacting and shows a histogram for better visualization. The MACD signal line oscillates between two levels. By combining them into one BB MACD indicator, traders can see the direction and strength of the ongoing trend.
The potential buy signal happens when the MACD crosses above the Bands line, and the opposite is true for the potential sell signal. Using solely this indicator may not be profitable. It is always better to use a combination of indicators. It can be downloaded from the official store of MQL5 and is absolutely free.
The Market Facilitation Index (MFI)
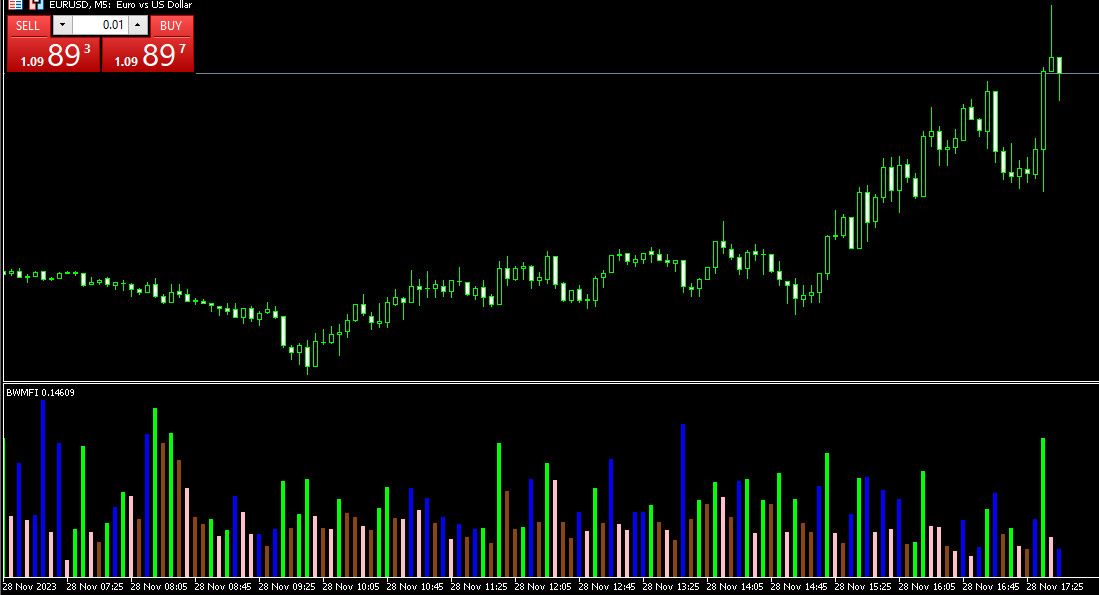
Market Facilitation Index is a technical indicator developed by Bill Williams, and is designed to provide insights into the relationship between the current price of an asset and its volume. The volume itself is a potent indicator and is widely used for filtering false signals. Using it in combination with the current price can offer useful insights into current market conditions. MFI can be used to identify reversal points and assess market efficiency. The purpose of MFI is to show the change in price by considering the relationship between the asset’s high price, low price, and volume. Volume helps MFI incorporate important insight into how money flows currently in the market. The formula for calculating the MFI is: MFI = (High - Low)/ Volume. While the indicator is not new, there were many newer versions developed for MT5. It can be downloaded freely from the net and applied to charts, increasing traders’ decision-making accuracy.
According to Bull Williams, the bullish signal is when the MFI and the volume are rising, and the bearish signal occurs when opposite conditions are met.
If the MFI is rising, but the volume is falling, it should be taken as a false signal. Again, it is always better to use MFI in conjunction with other indicators and signals to increase the likelihood of successful trades.