Instead of chasing ATHs on the S&P 500 or Nasdaq, it makes sense to look at the stock indices that are lagging behind, more notably the Dax, and figure out whether it’s lagging behind or showing underlying weakness.
DAX on the Daily Timeframe
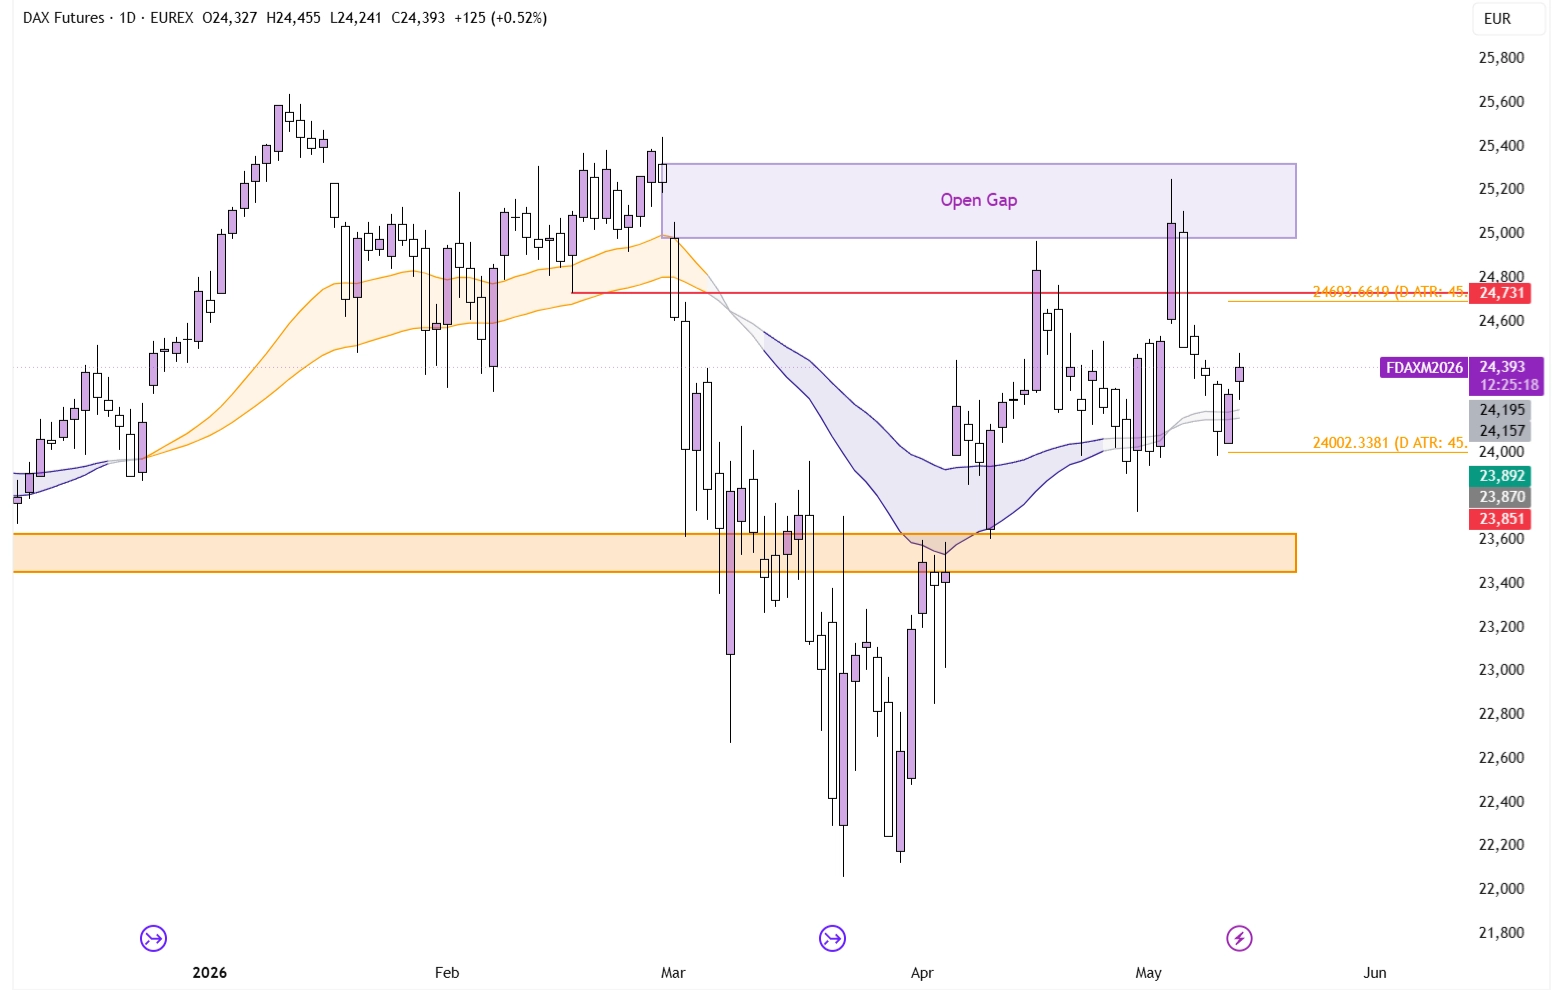
The chart is surprisingly in balance, with the Thursday open being located right in the middle of the range that’s been holding for the past six weeks. Furthermore, our momentum indicator is grey, indicating a lack of direction where neither side is winning.
However, there is one factor that’s giving us a small peek at the future direction. Price has consistently been making Higher Highs and Higher Lows, showing that despite the resistance, and despite the geopolitical constraints, the index is catching bids.
DAX on the 4-hour Timeframe
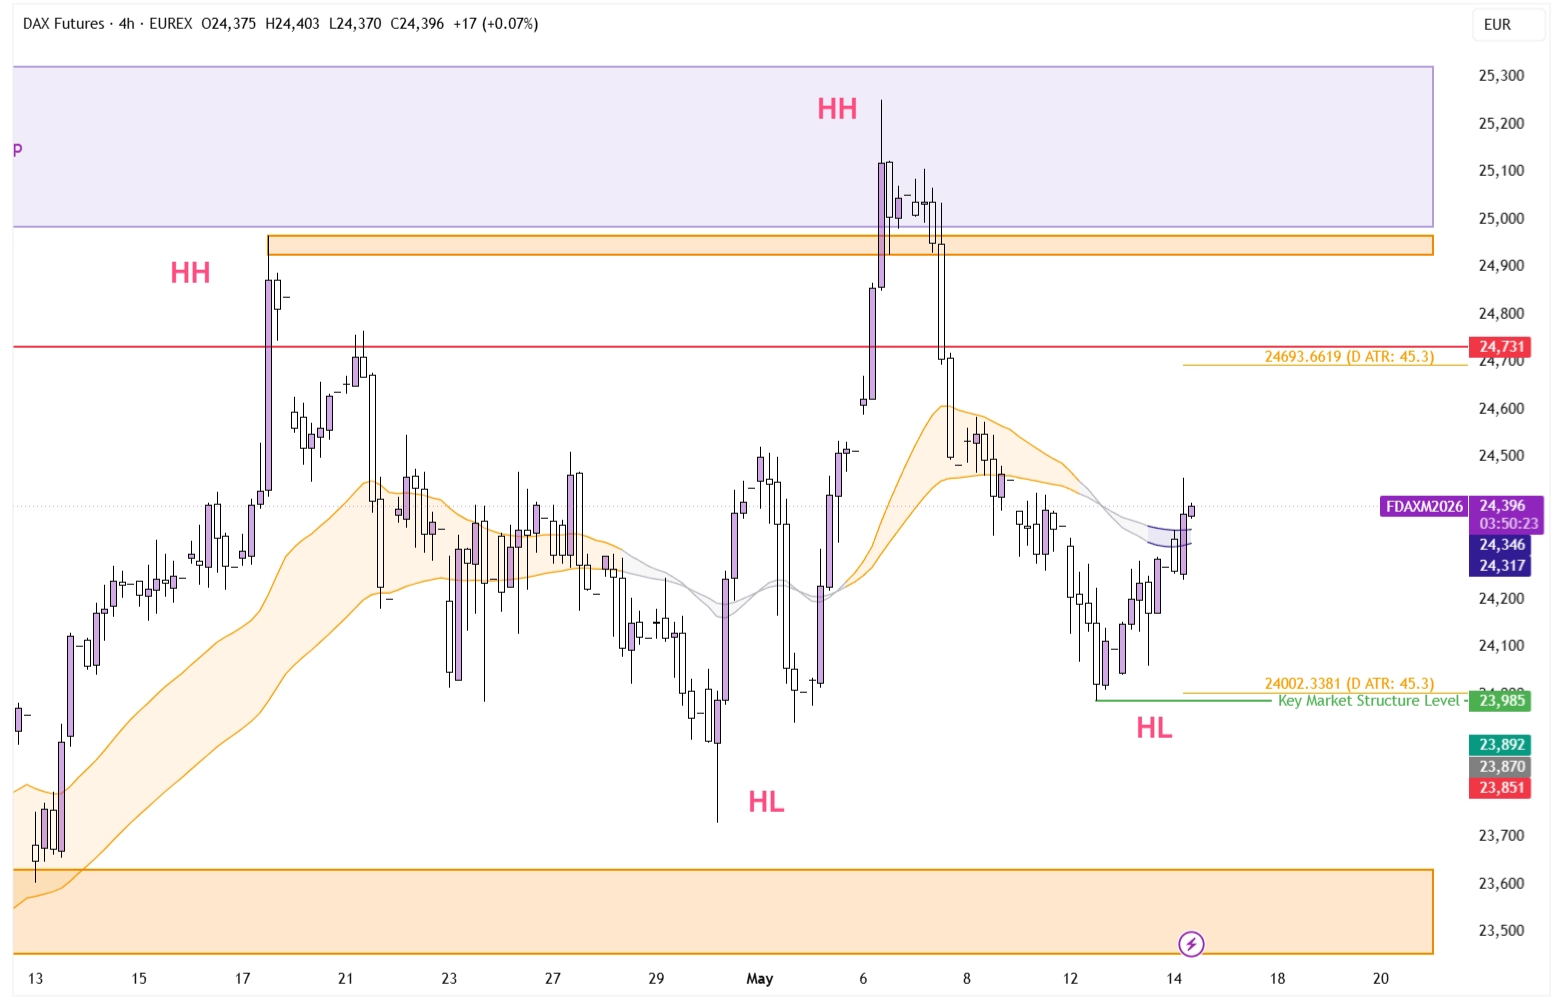
The 4-hour timeframe shows us these swing points very clearly, alongside the €23,985 level which is key for the current market structure to hold. If this fails, the odds of a breakdown materially increase, especially if it were to coincide with a pullback from the S&P.
Right now however, it seems like the DAX is more so just catching up, although that move will likely take a couple of days. The Average True Range is currently at 450 points, so a ‘normal’ up day would only bring us to levels of the April 17th high. The lesson to learn from this is that it will take a consistent effort of strong days for price to break out of current resistance and break out to new All-Time Highs.