Dollar Index: Bullish Breakout After Fed’s Measured Cut
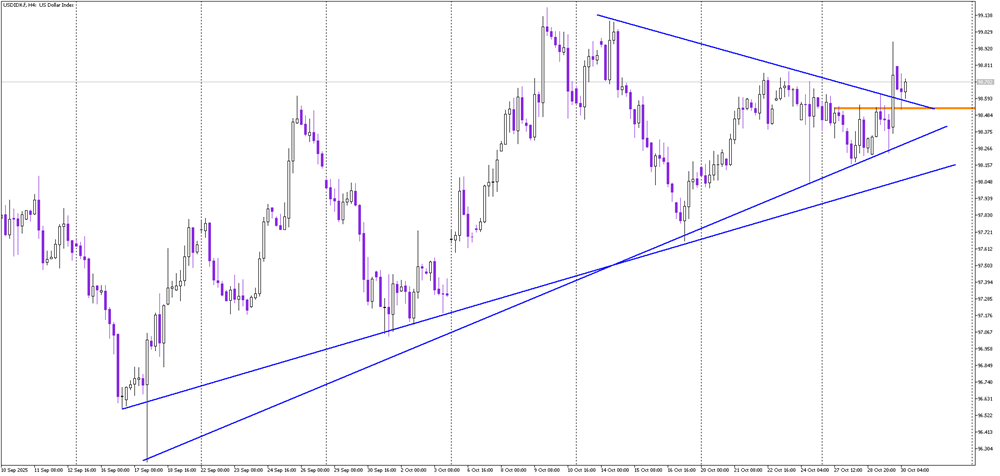
Technically, this shift in sentiment led to a clean breakout from the symmetric triangle pattern, marked with blue lines on the chart. The triangle had been compressing since mid-October, reflecting indecision and low volatility. Yesterday’s move to the upside broke that consolidation range, confirming renewed bullish momentum in the short-to-medium term. The breakout candle closed firmly above the upper boundary of the triangle, suggesting that buyers have regained control after several days of sideways trading.
The next step for traders is to watch whether the breakout holds. The orange horizontal level — the former resistance — now becomes key support. As long as the price remains above this zone, sentiment on the Dollar Index stays positive, and the path of least resistance points higher. However, a drop back below the orange support would invalidate the bullish scenario, creating a false breakout setup and potentially opening the door to a reversal move to the downside. For now, though, momentum and fundamentals align in favor of further dollar strength.