
Ethereum Slides as Bitcoin Break Sparks Broader Sell-Off
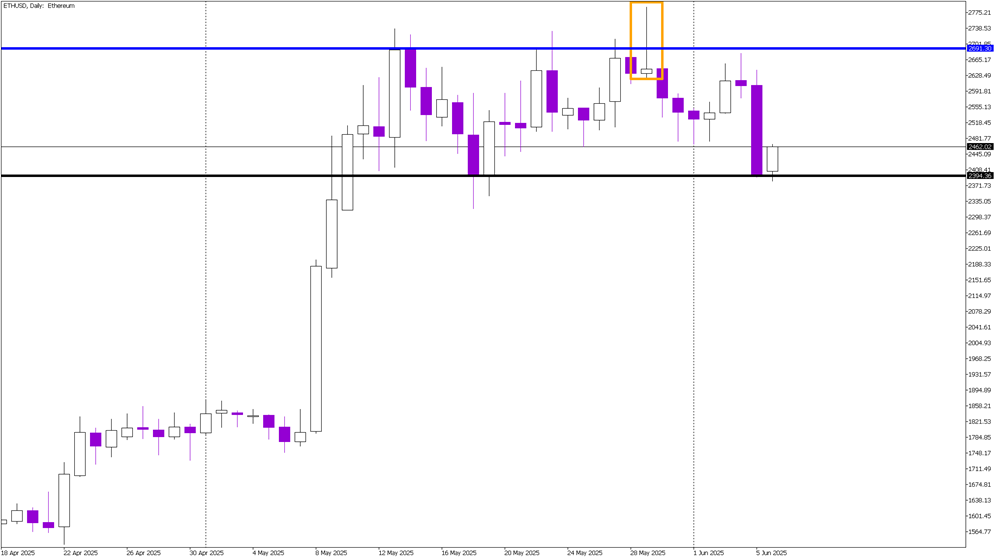
We recently discussed the situation on Bitcoin, highlighting the possibility of a larger drop due to a head and shoulders pattern forming on the chart. That scenario played out yesterday, with Bitcoin sliding sharply. Ethereum, naturally correlated, followed suit with a decisive bearish candle on the daily chart, marking its lowest close since May 19.
The current bearish momentum in Ethereum can be traced back to a false breakout above $2,700. That move formed a classic shooting star candle—highlighted on the chart with orange—and sent a clear signal of rejection from higher levels. This false breakout continues to cast a shadow on sentiment, reinforcing resistance at that level.
As of now, Ethereum is hovering just above the next key support zone, defined by the black horizontal line around $2,400. We are witnessing a slight bounce off this level, which isn't unusual after a steep drop. However, should the price break below this support decisively, it would confirm the negative outlook and likely trigger further selling pressure.
Traders should keep a close eye on the $2,400 zone. A sustained hold above it could offer temporary relief or even set up a short-term rebound. But any daily close below this mark will be a firm confirmation that the bears remain in control, and we may see Ethereum push deeper into correction territory.