S&P 500 delivers on its Santa Rally Expectations - USDCHF Breaking Down from Symmetrical Triangle
Introduction
Happy New Year! 2025 saw the start of our Weekly Market Pulse series, and we are excited to be by your side in the financial markets in 2026. Let’s recap what happened in the final week of trading in 2025.
Global Macro
Due to the holidays, no new macroeconomic news came out. Instead, we will do a short recap of where all the central banks stand regarding interest rates and examine what the market anticipates for 2026:
| Central Bank |
Current Rate (Early 2026) |
Inflation (Latest) |
Unemployment (Latest) |
2026 Year-End Forecast |
| US Federal Reserve |
3.50% – 3.75% |
2.8% (Core PCE) |
4.4% |
3.00% – 3.50% |
| European Central Bank |
2.00% (Deposit) |
2.1% (Headline) |
~6.3% |
2.00% (Steady) |
| Bank of England |
3.75% |
3.2% |
~4.3% |
3.25% – 3.50% |
| Bank of Japan |
~0.25% |
2.0% |
~2.5% |
0.50% – 1.00% |
| Bank of Canada |
2.25% |
2.2% |
6.5% |
2.25% – 2.75% |
| Reserve Bank of Australia |
3.60% |
3.8% |
4.3% |
3.85% – 4.10% |
The most important measure here is the rates by the end of 2026. In the U.S., fed funds rate futures have a 75% chance of two 25bps rate cuts this year, bringing the rates down to 3%. However, Powell’s term as Fed chair will run out in May, with his replacement very likely being a dove, increasing the likelihood of rate cuts later into the year.
Equities
With the 2025 books now officially closed, we can do a short recap of how equities as a whole performed. 2025 was truly a stellar year for indices, where Europe and Japan outperformed their American counterparts.
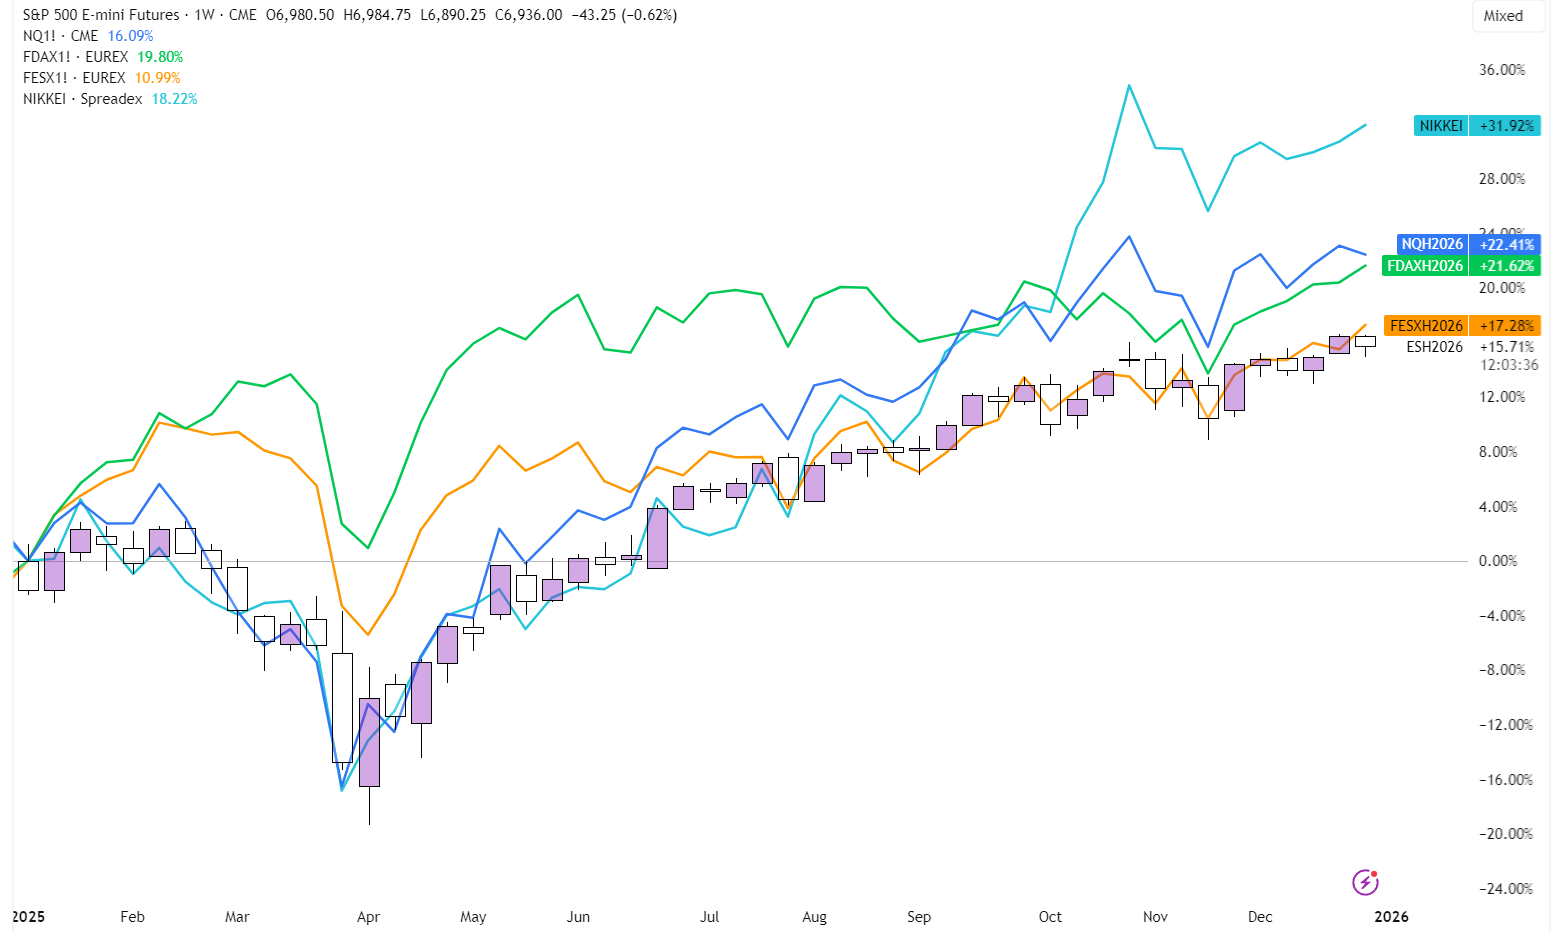
2025 Performance for all major indices
Looking at this chart, it seems like the S&P 500 and the Euro Stoxx 50 had very similar performance, but since the Dollar is down 14% over the year, the real performance of European Indices was much higher. The same concept is true for the Nikkei, as the Yen is also down 14% against the Euro and is almost flat against the USD.
This chart, however, shows the corrected 2025 performance for all indices, with the Dax and Euro Stoxx 50 clearly the best of the pack, although the Nikkei was closely following:
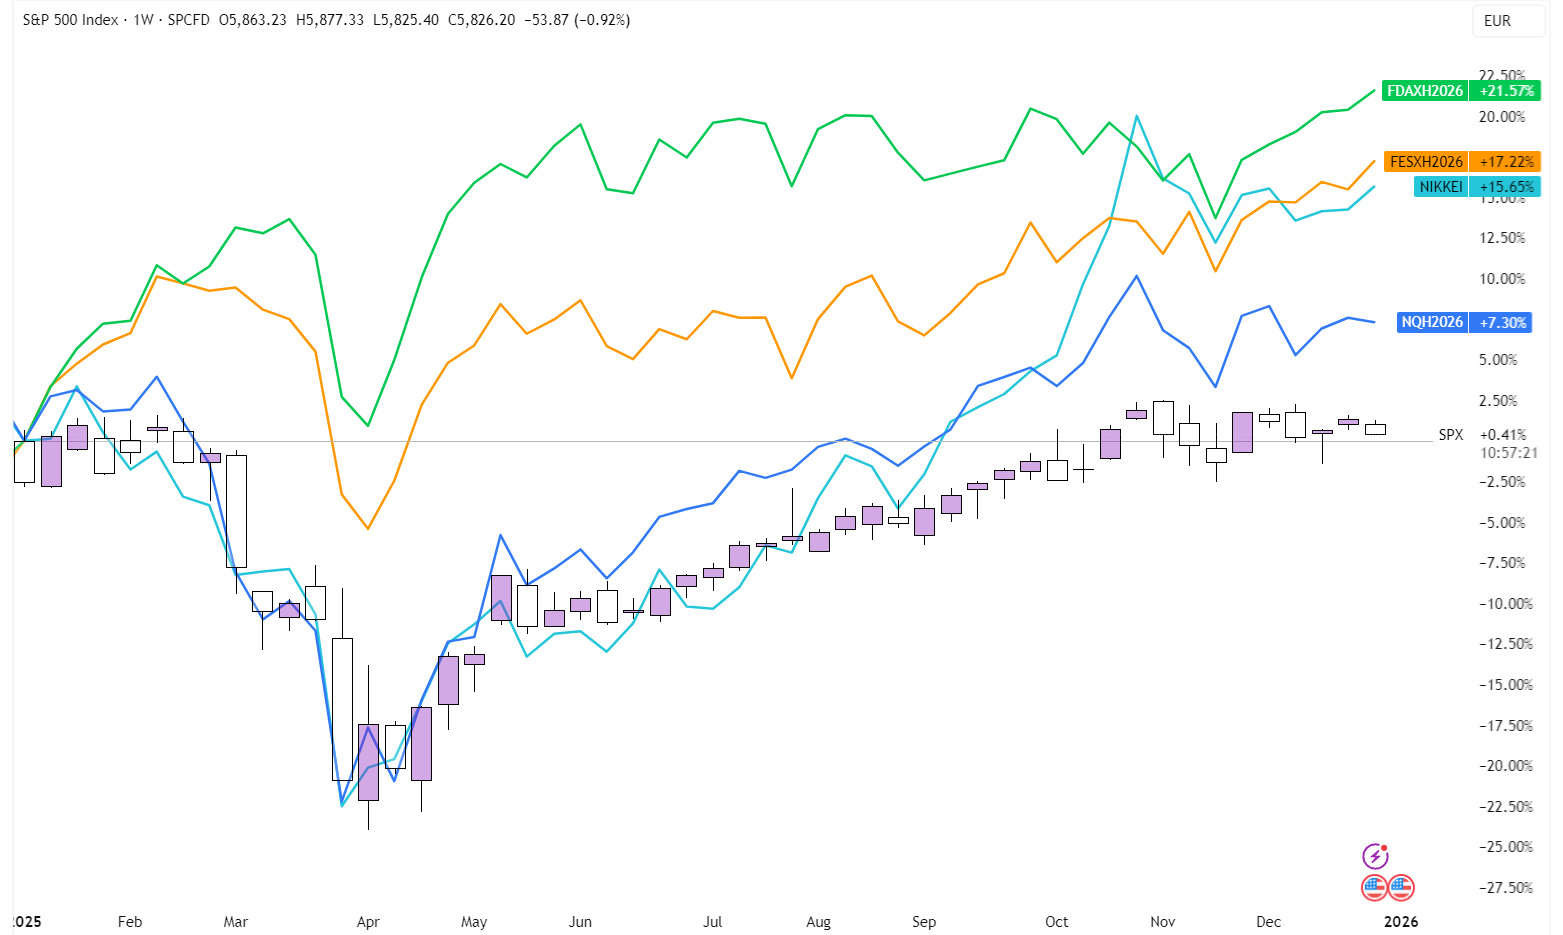
Corrected 2025 performance for Indices
Forex
Forex saw a very calm final week of trading as holidays led to muted volume and volatility. USDCHF, however, did create some interesting price action, as it seems to be breaking down from this symmetrical triangle.
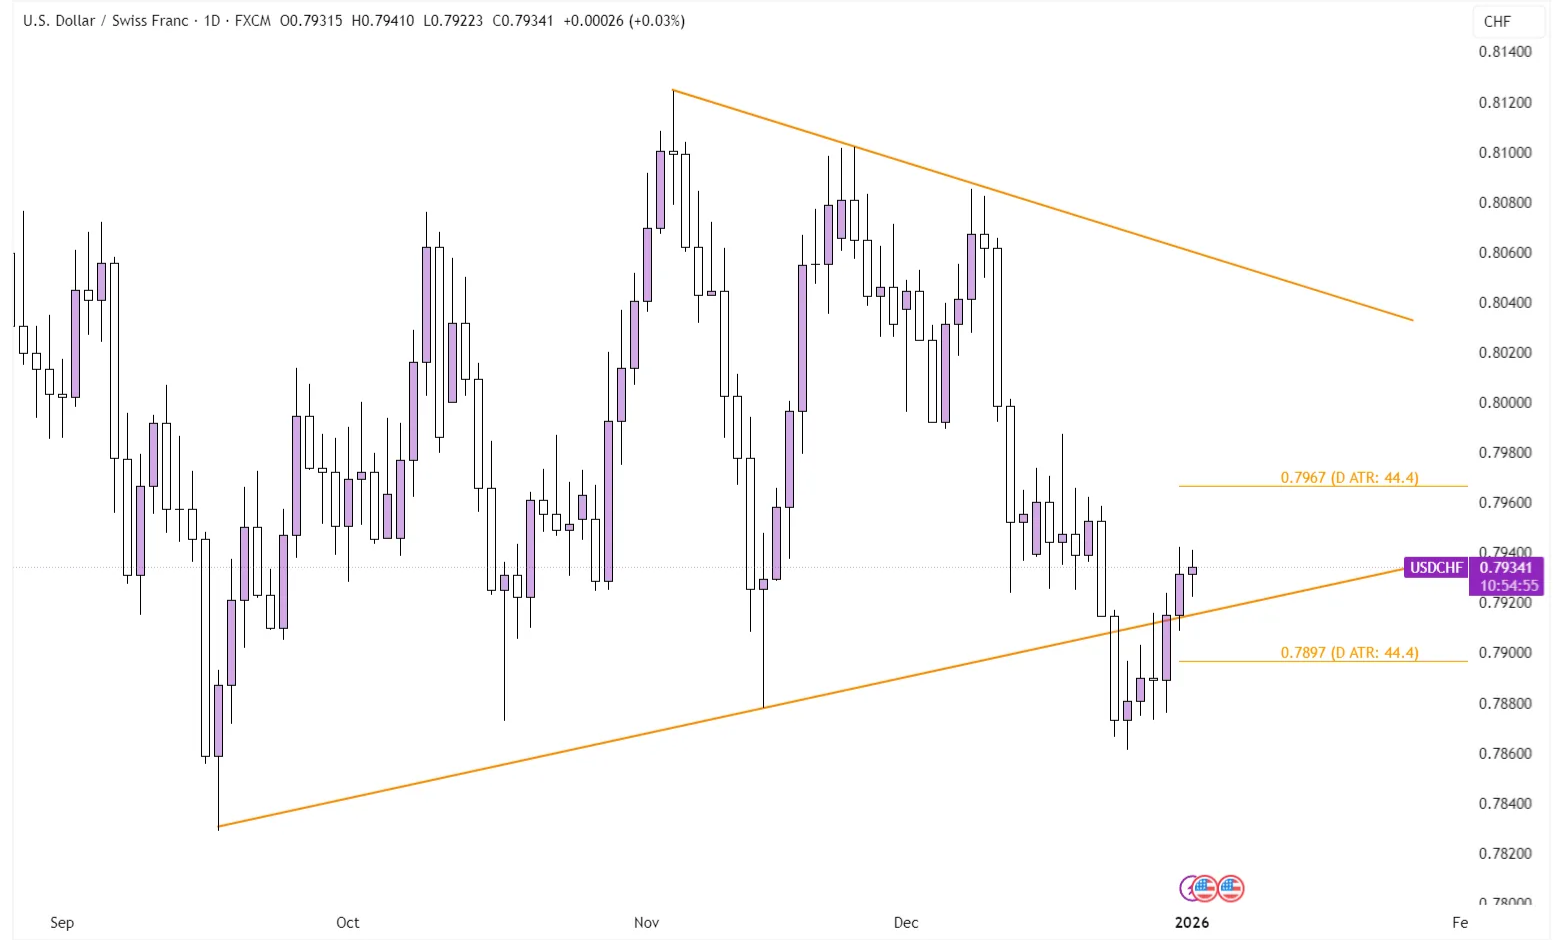
USDCHF on the Daily Timeframe
However, these patterns are prone to creating fake breakdowns or breakouts, so caution is advised. If price can durably accept back within, it more so elevates the likelihood of a retest of the upper side, as the failed breakdown shows buyers are willing to step in at the 0.786-0.788 area.
Commodities
2025 saw a stark divide in performance within commodities, while Gold (+64%) and Silver (+148%) put in some of the very best years in all of their history, Oil and Natural gas were respectively down and flat. In the short term, for Gold to continue its rally, we’d need to see it durably reclaim the $4.380 level, which is the range Volume Value Area High.
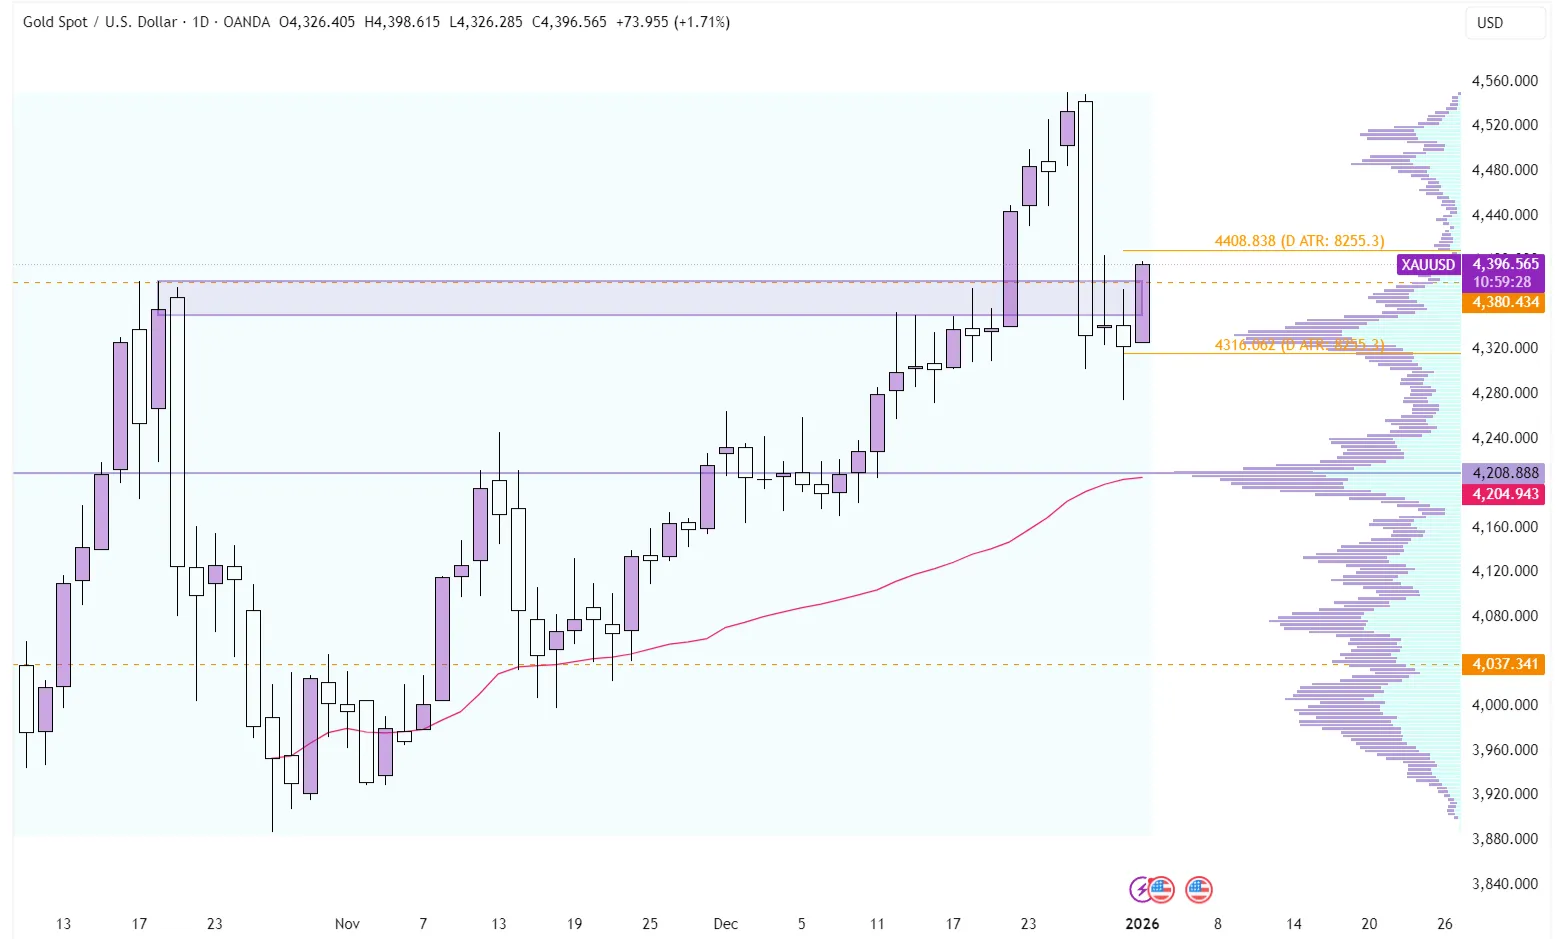
Gold on the Daily Timeframe
Failure to hold this level means acceptance back into the October-December range, likely spending a lot of time in the $4.038-4.380 range.
Conclusion
One-sentence summary of the week:
Markets were calm during the Holidays as we closed the books on an action-filled year.