Introduction
Despite the lighter macro-economic schedule, the markets still gave us plenty to unpack. The Dollar regained its upward course, while high Oil prices are consistently dragging down stock indices. These energy prices are creating an environment where, every day they stay elevated, they are dragging down risk-on assets, with recession risks re-elevating.
Global Macro
After last week’s flurry of interest rate decisions, this week provided a macroeconomic ‘break’, with the only major events being Australian & British CPI. Data came in respectively at or 0.1% below expectations for GBP & AUD.
However, the huge rise in energy prices is overshadowing this data, as these price changes are not yet reflected in today’s data.
Equities
The S&P 500 completed its fifth consecutive down week as the Iran war is flipping the script. In a typical market environment, indices tend to slope upward over time as the economy grows and the index rebalances to include only the most successful companies. This creates the persistent "upward drift" historically responsible for the average 7% annual return.
Currently, however, the situation is reversed. The longer oil prices remain at these extended levels, the more the effects ripple through the economy. As businesses incur higher energy costs, those expenses are inevitably passed on to the consumer, keeping inflation sticky and making the “higher for longer” rate path more likely.
S&P 500 on the Daily Timeframe
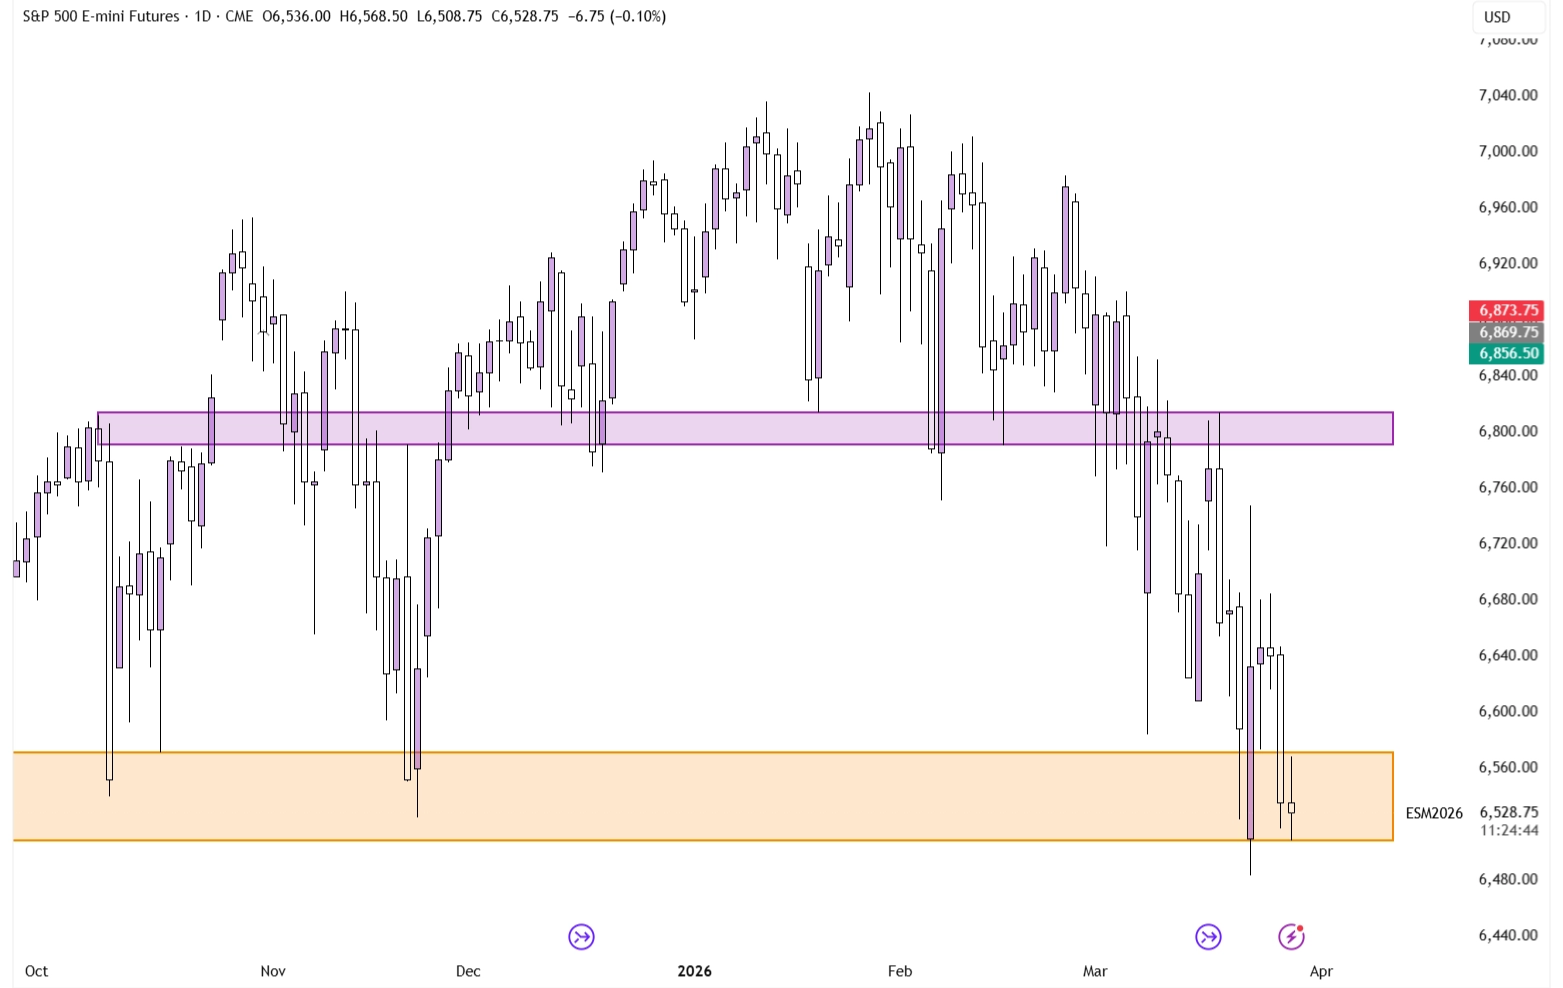
Last week, we discussed this orange support zone, noting that the price was likely to gravitate towards it and react from it. On Monday, that’s exactly what happened. Price went a tad beyond the lower level, but moved aggressively higher from there.
However, today the index is closing back in that support level. Despite the fact that this market is mostly news-driven, this chart looks bearish. Generally, a longer-term bottom does not consist of price returning to the previous lows in a timespan of just a couple of days. From a technical perspective, this thus looks slightly bearish, although, as always, the picture can change quickly.
Forex
The Australian Dollar has had a rough couple of weeks. Since the country’s main export is ores (such as Gold), the currency has historically always had a strong correlation to Gold prices, with the current correlation factor residing at 0.878.
AUD/USD on the Daily Timeframe
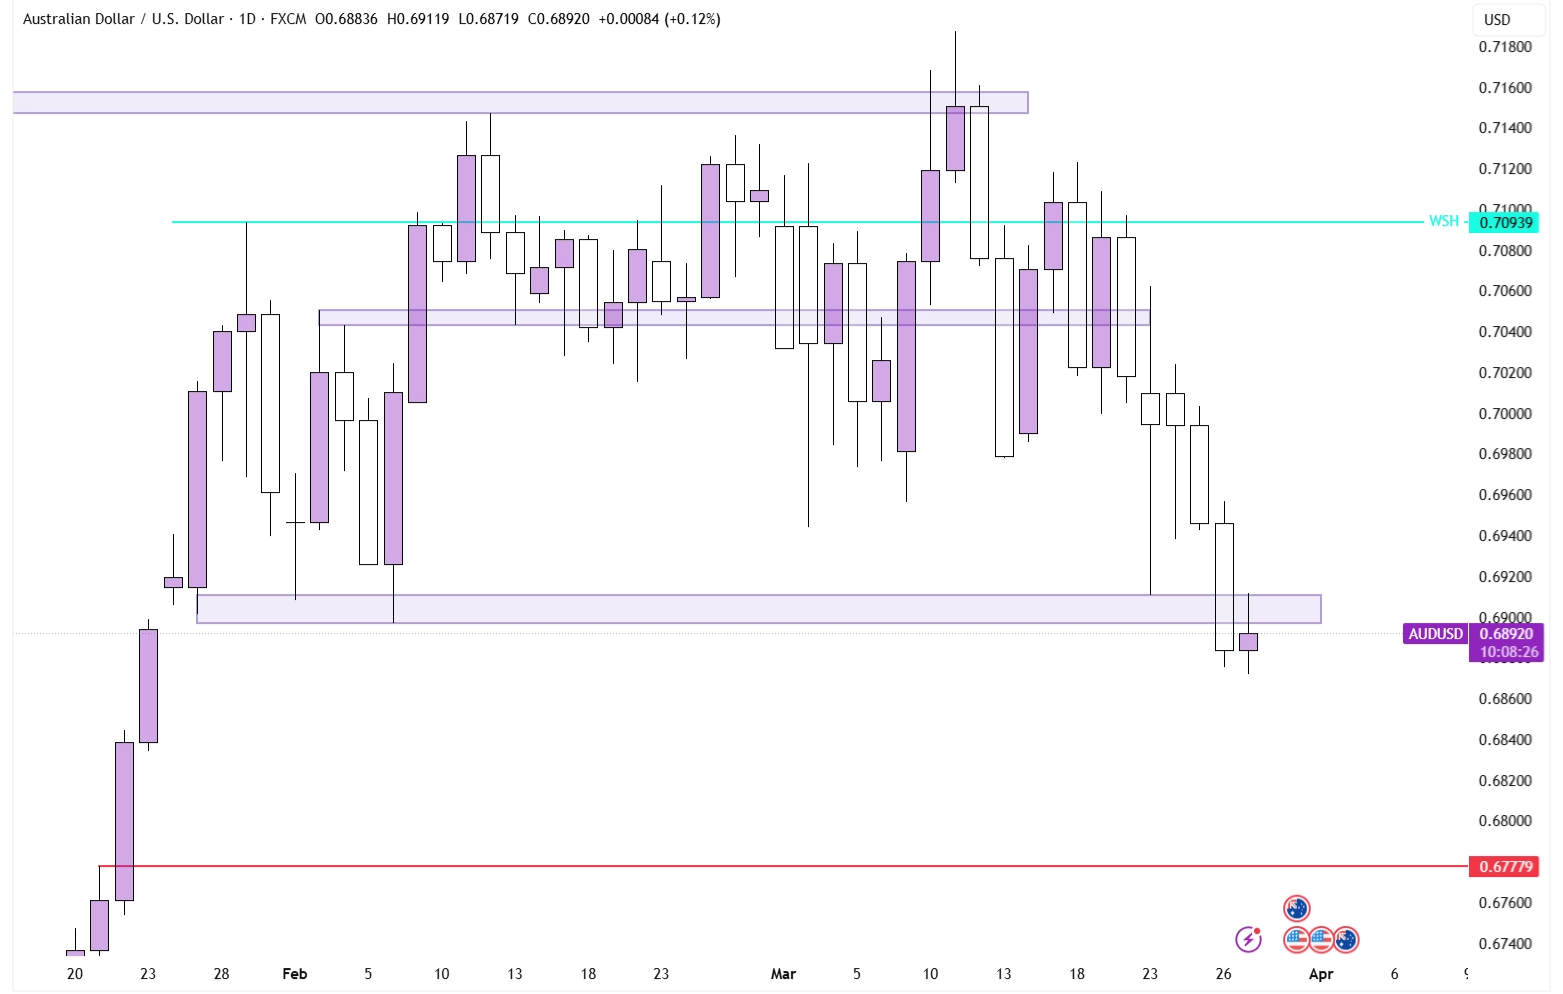
On Thursday, price lost the lower bound of this multi-month range, with price now retesting the underside of it, which has effectively turned into resistance. If price manages to close below the upper end of this now resistance zone, it will shift the technical picture bearish here. From that point on, the next logical downside target sits at 0.67779, consisting of two old highs.
Commodities
Despite Oil catching all the headlines, prices for this week have been mostly flat, as a short excursion lower retraced. Because of that, we’ll use the space to focus on Gold, which has also been highly volatile.
XAU/USD on the Daily Timeframe
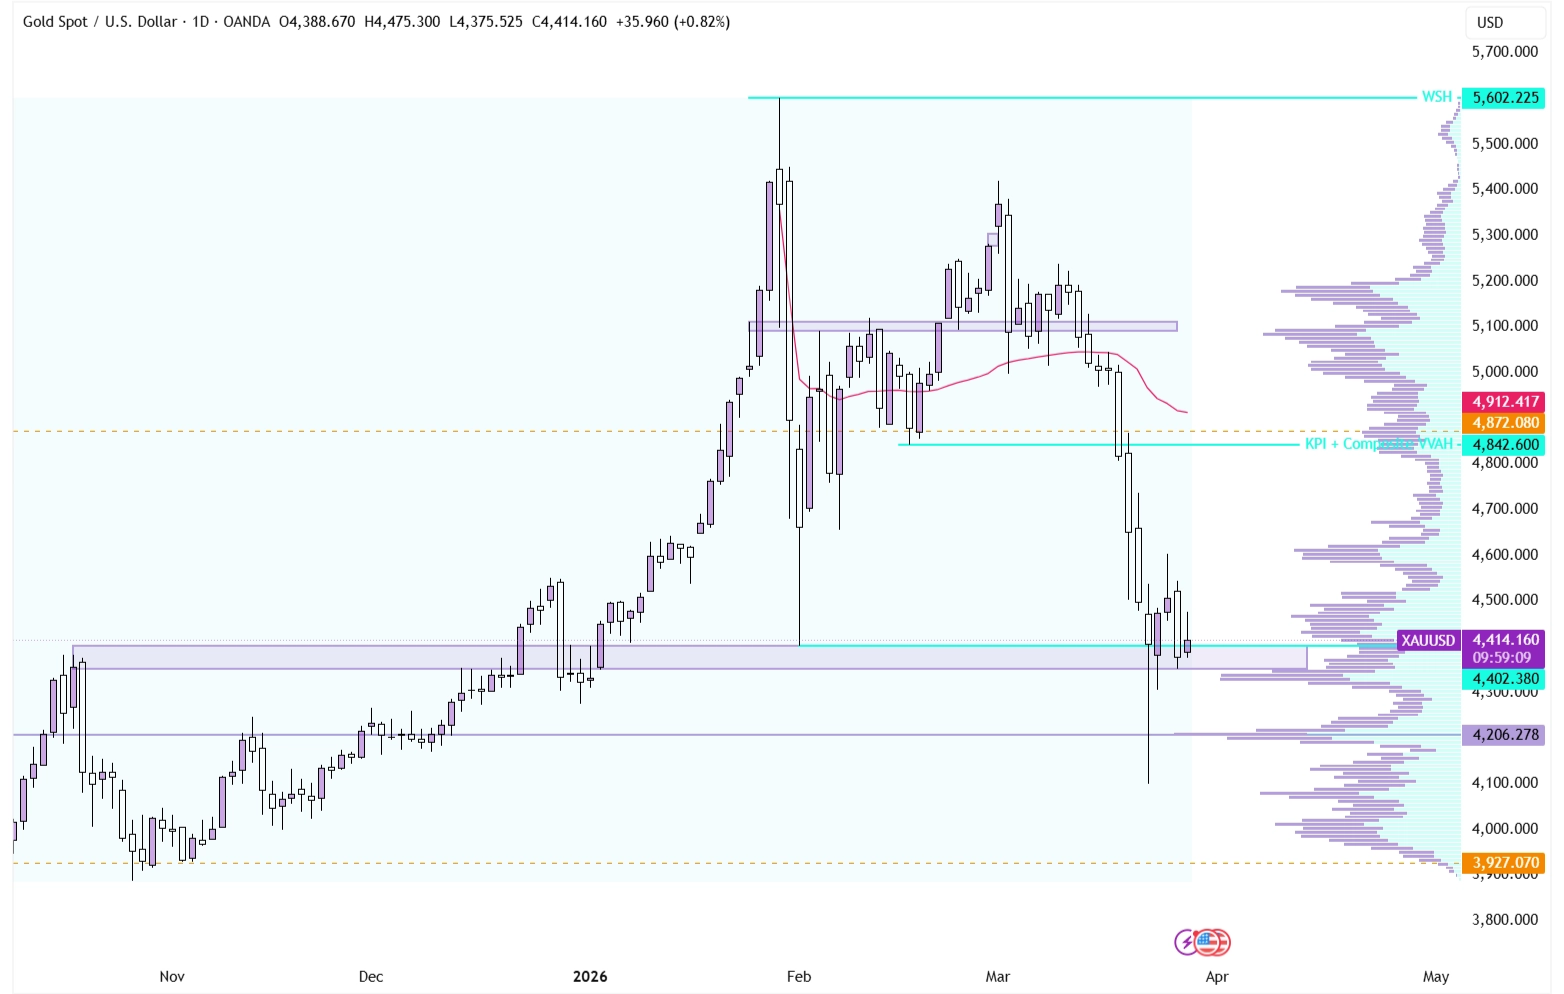
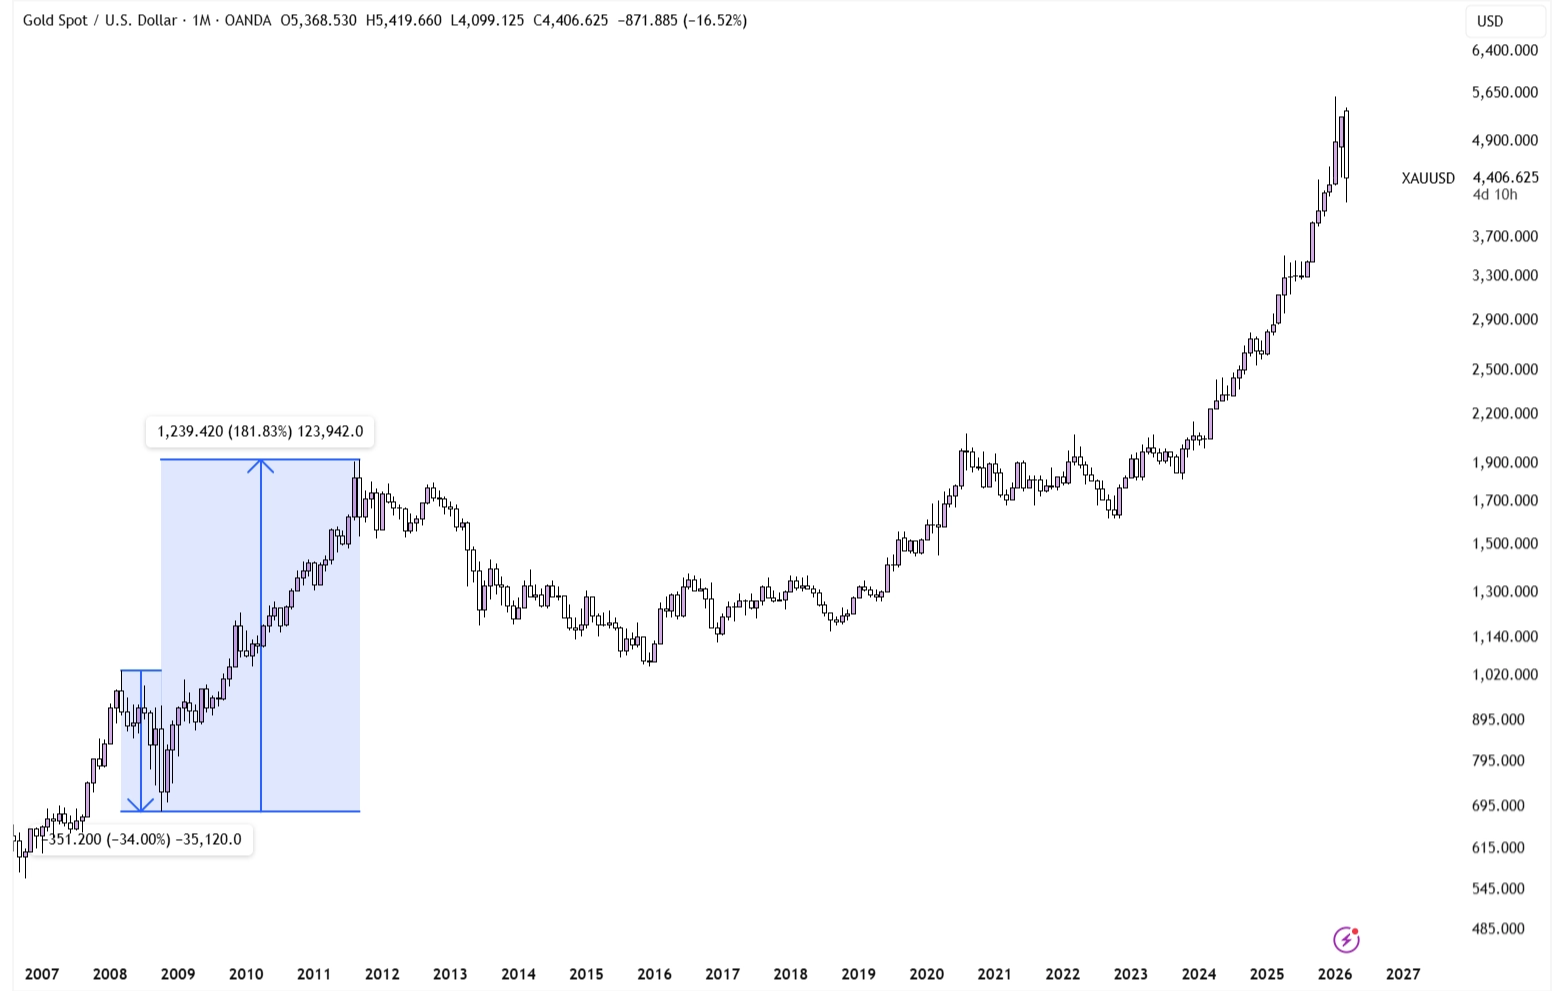
Prices are now down 21% over the timespan of two months, as the largest asset of the world, that is a very big retracement, especially as Gold is seen as the ‘ultimate safe-haven’. However, it doesn’t necessarily mean yet that the bull run is over; in 2008, Gold had a 34% peak-to-trough drawdown, before it topped three years later.
XAU/USD on the Monthly Timeframe
So this isn’t necessarily the ATH, what it does likely mean, however, is that it it might take, under supporting circumstances, at least a couple of months to reclaim the top. Gold isn’t like a tech stock; it can’t just move up 5% in a day, as the market is so large, it requires a big sum of money to move it.
Conclusion
One-sentence summary of the week:
Stocks are continually down as Oil stays at $90 and Gold collapses.