Introduction
This week saw a plethora of macro-economic data, ranging from U.S. inflation surprises to major interest rate decisions. Between a historic shift in Japan and Silver’s record-breaking run, there is plenty to catch up on. Here is your weekly breakdown of the action across the markets.
Global Macro
This week saw a plethora of macro-economic data, ranging from inflation and unemployment data to interest rate decisions.
U.S. Inflation
As always, the focus continues to be on American monetary policy. American inflation caused a big surprise as YoY CPI came in at 2.7% rather than the expected 3.1%. This proves that the Fed was on the right path to be cutting rates, as inflation is indeed coming closer to their 2% target. There are some concerns whether this number is less reliable due to the recent government shutdown, but this number nonetheless shows that inflation does seem to be coming down, which increases the likelihood of future rate cuts.
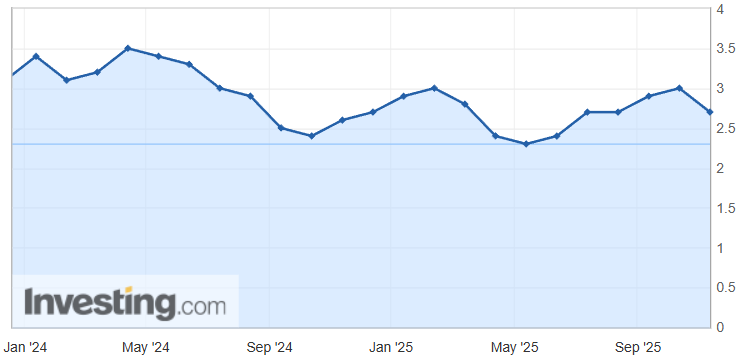
U.S. Consumer Price Index
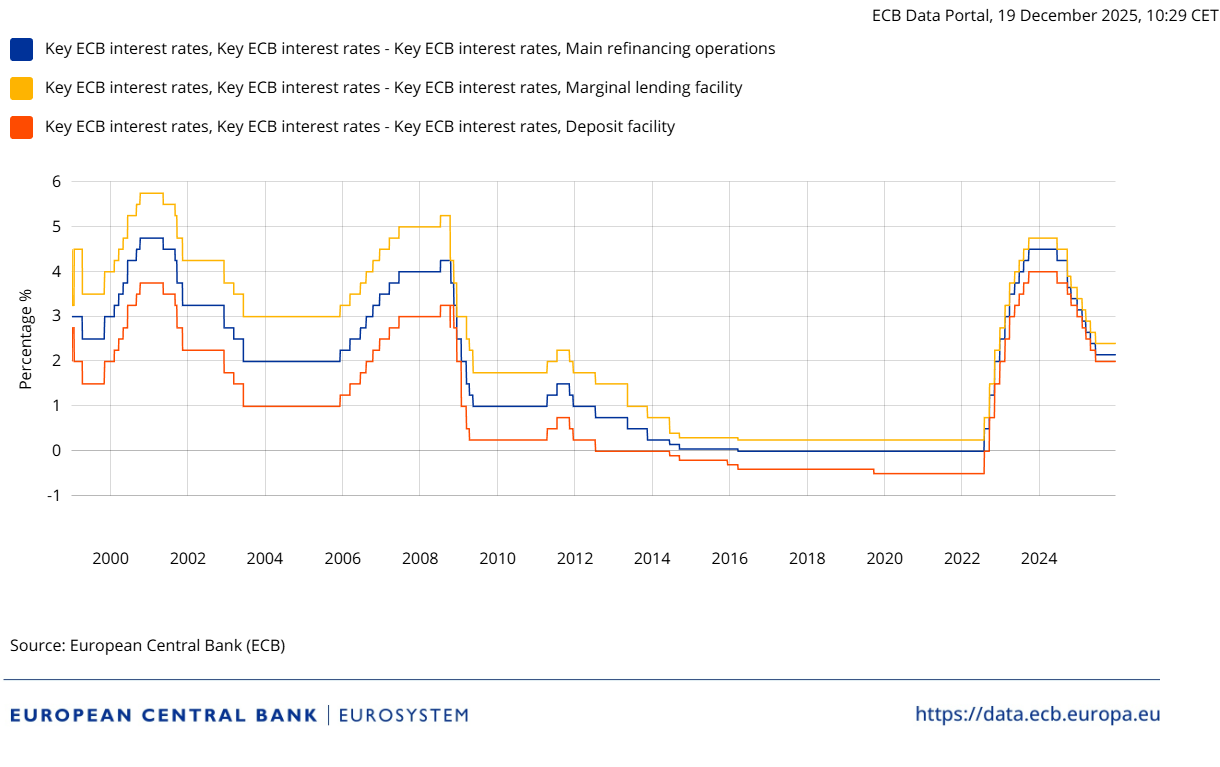
ECB Interest Rate Decision
As expected, the European Central Bank held rates constant. Since they have achieved their 2% targeted inflation, and the economy is proving to be stronger than expected, the ECB has little reason to make any changes to the interest rates. Their current rate is likely to be around the neutral rate where monetary policy is neither accommodative nor restrictive, so the only way to see changing interest rates is a deteriorating economy or surging inflation.
Bank of Japan Interest Rate Decision
With the BoJ’s rate hike to 75bps, Japanese interest rates are now the highest they have been in over 30 years. Historically, Japan has been a country with very accommodative monetary policy, prioritizing economic growth over inflation.
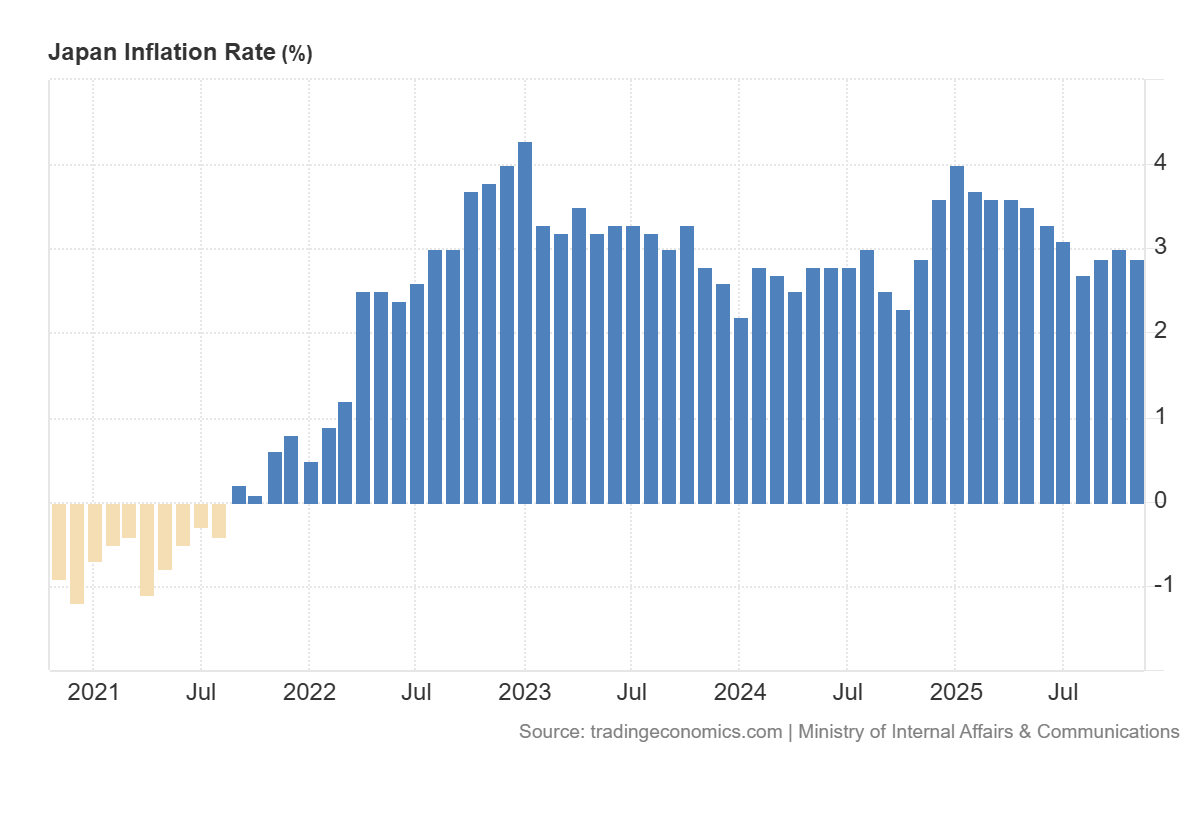
However, inflation in Japan has now been far above their target ever since 2022. This has forced the BoJ to put an end to their accommodative policy and focus on fighting inflation.
Equities
American and Japanese indices were in a tight range this week, with bears and bulls fighting to gain control over the medium-term trend. The S&P 500 lost the key $6,791- 6,811 support on Wednesday. At this point, it looked like sellers had gotten in control of the trend and price seemed set to rotate lower.

S&P 500 on the Daily Timeframe
However, coming into Thursday’s New York open, prices regained this support area with an immediate retest of the $6,811 which crucially held. Price is now likely to test the upper end of this range at $6,891.
European Strength
On the European side of the Equity market, both the DAX and Euro STOXX 50 outperformed this week.
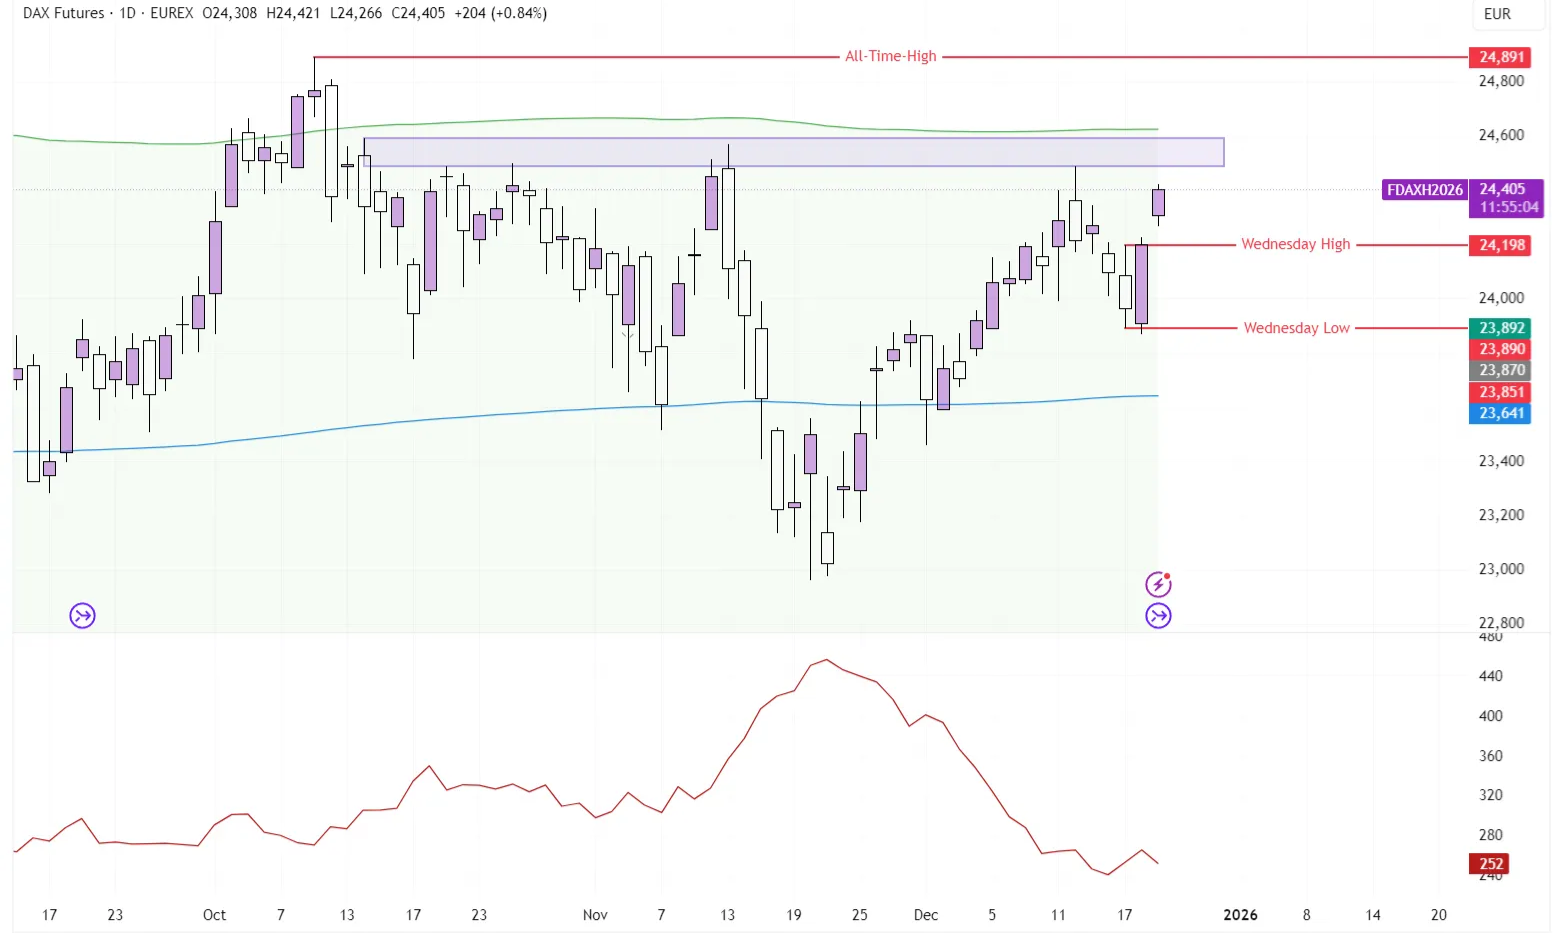
DAX on the Daily Timeframe, with a 14-period ATR
Just like the S&P 500 and Nasdaq, the DAX suffered from a difficult start to the week. On Thursday however, price managed to create a True Bullish Engulfing on the daily chart, with price going below Wednesday’s low and ultimately closing above Wednesday’s High by three ticks.
Considering the range of Wednesday’s candle at 308 ticks, that was a showcase of very aggressive buying. Friday then opened with an impressive gap up, as price now seems set to test this key resistance area at €24,891.
Due to the strong recent momentum and the amount of times this level has been tested from the downside, it wouldn’t be unreasonable to expect price to break through €24,490 relatively quickly.
Forex
EURUSD was the pair to watch. On Tuesday, price saw a strong uptrend coming into the New York session. However, this trend got aggressively sold with price eventually leaving a Daily candle known as a ‘Shooting Star’. Shooting Stars are quite rare to come across as they require an aggressive trend in one direction that then also gets quickly reversed within that same session.
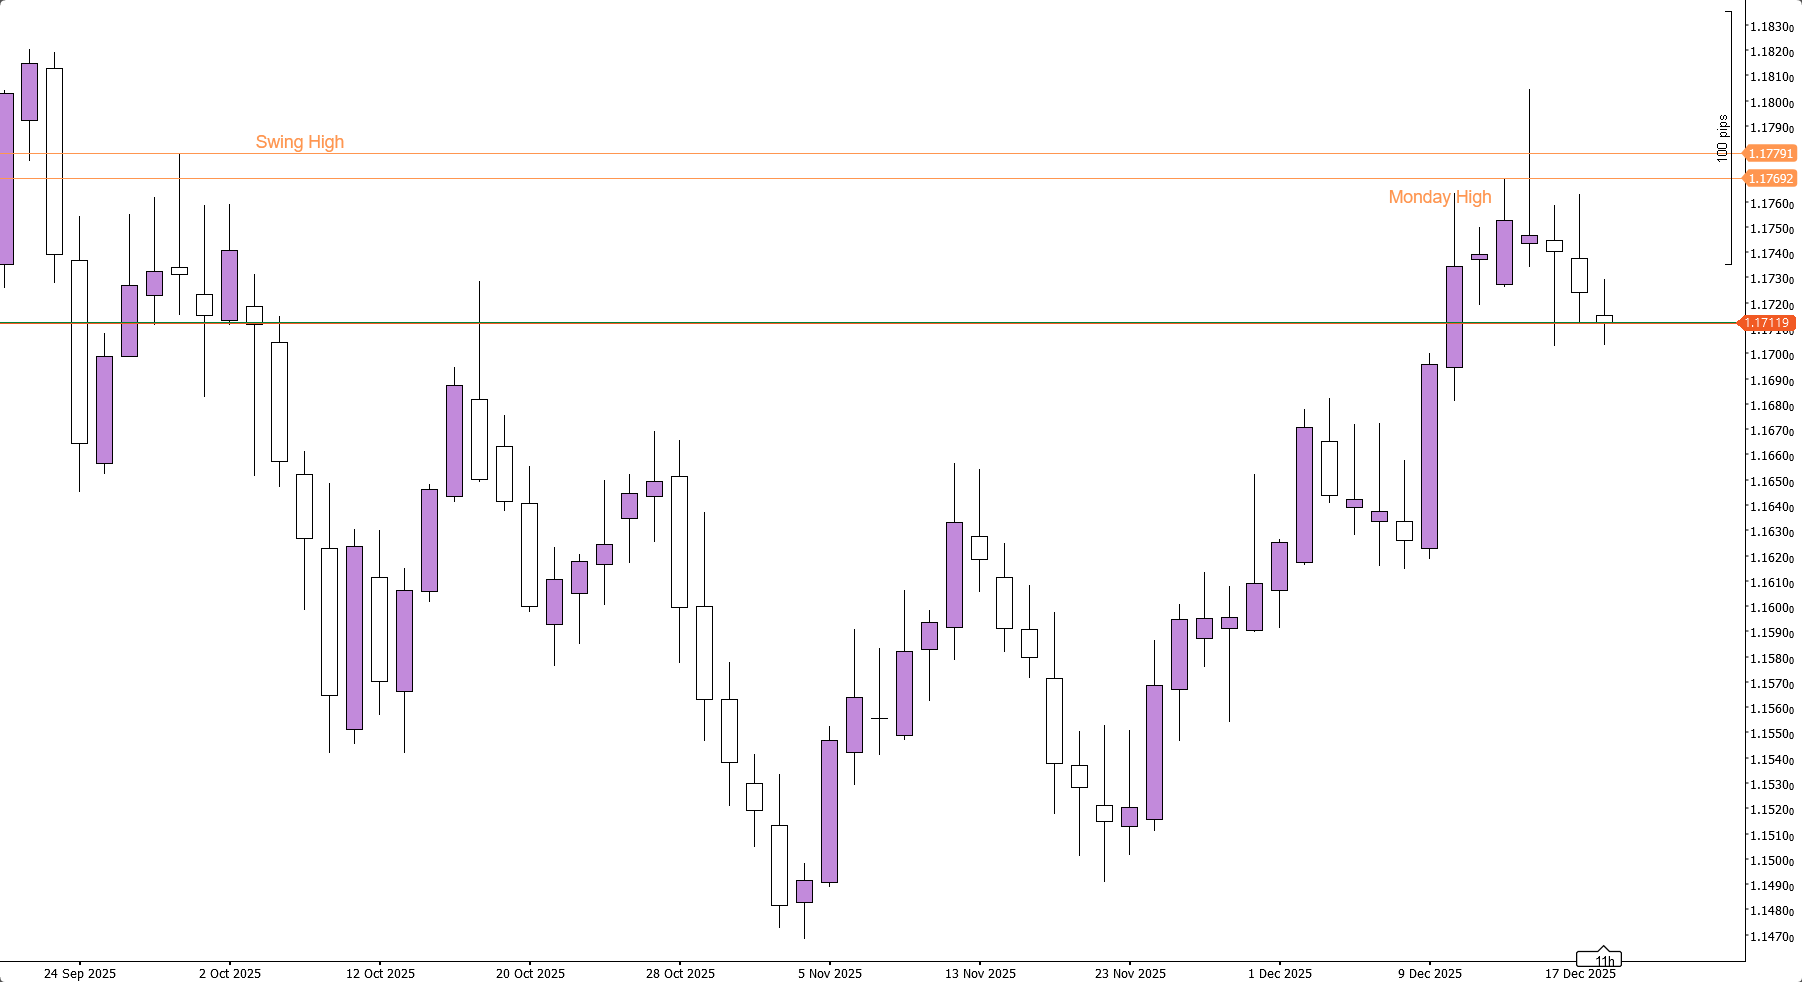
EURUSD on the Daily Timeframe
Because of this, Shooting Stars hold relatively high importance. However, even Shooting Stars on their own aren’t foolproof. Context is thus key. Traditionally, you want to see a shooting star come up right after a recent uptrend, and for the wick to sweep a key high.
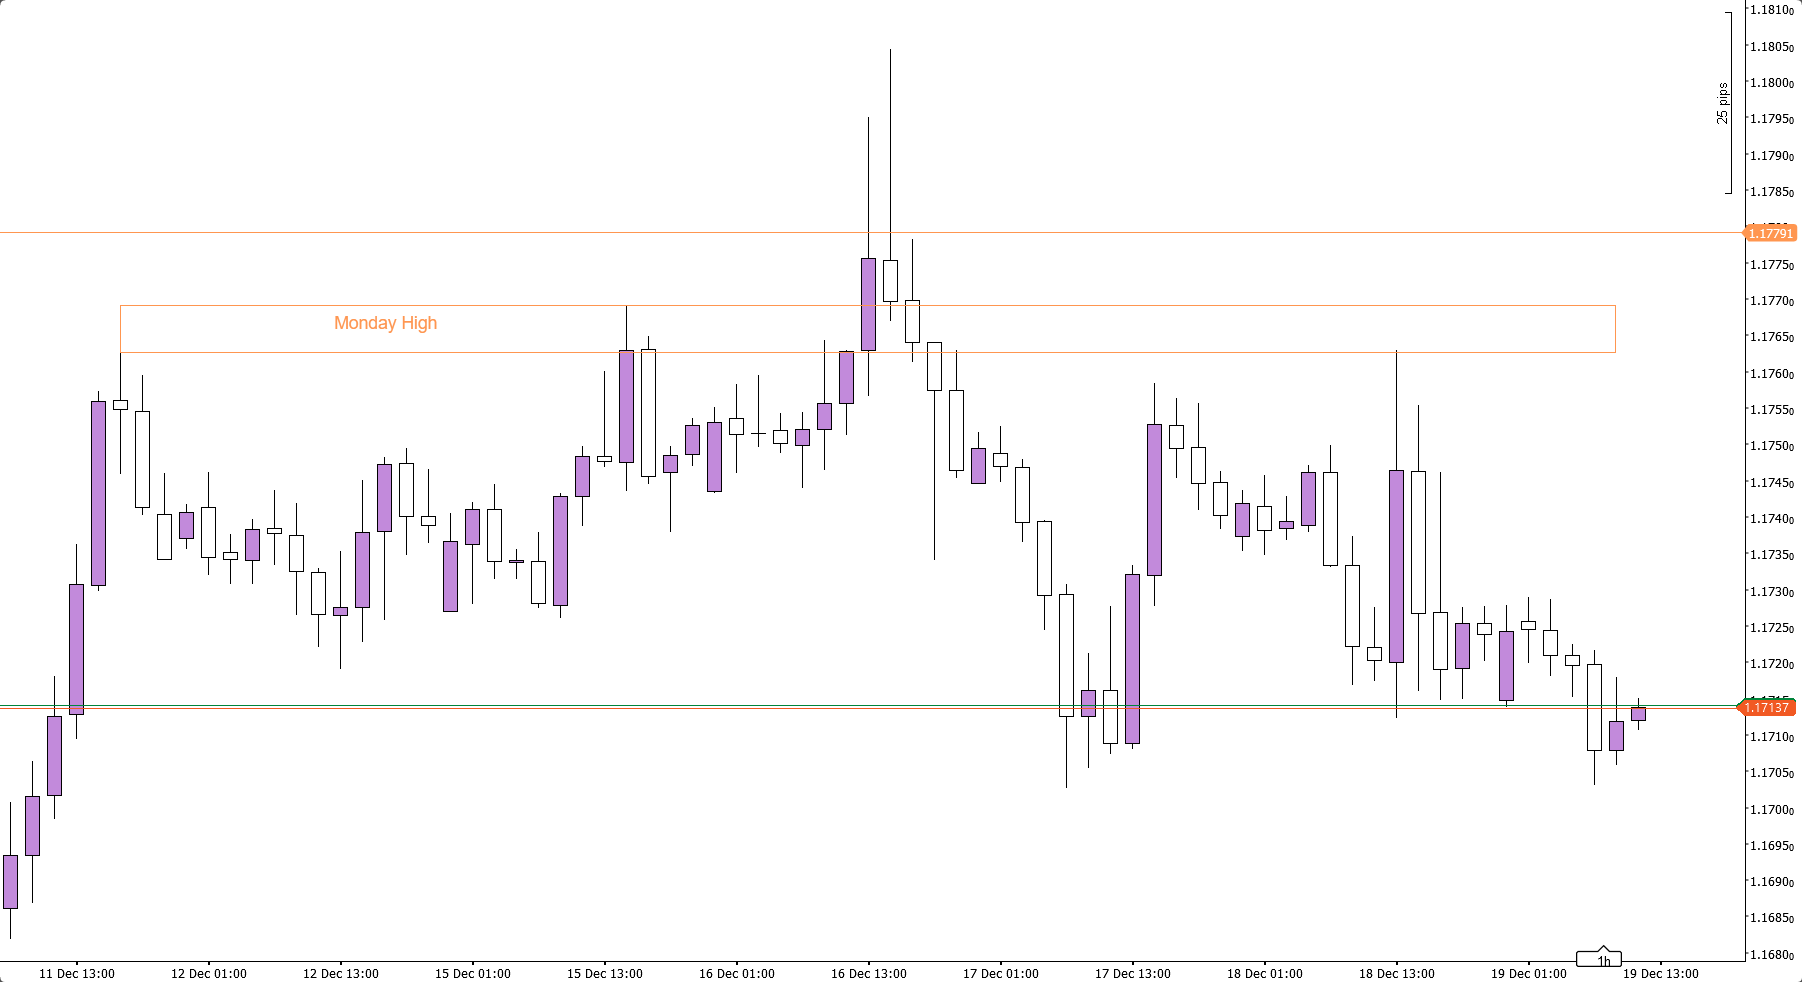
EURUSD on the 2-hour Timeframe
That is exactly what happened on Tuesday, which thus created a strong bearish bias coming into the London open on Wednesday.
With Shooting Stars, the high of the day prior to the shooting star becomes a key Resistance area. In this case, price ultimately went up to the range resistance, just under this key high and moved aggressively lower from there.
Commodities
In commodities, the past few weeks have been dominated by Silver outperformance, Gold lagging and continual Lower Lows for Oil.
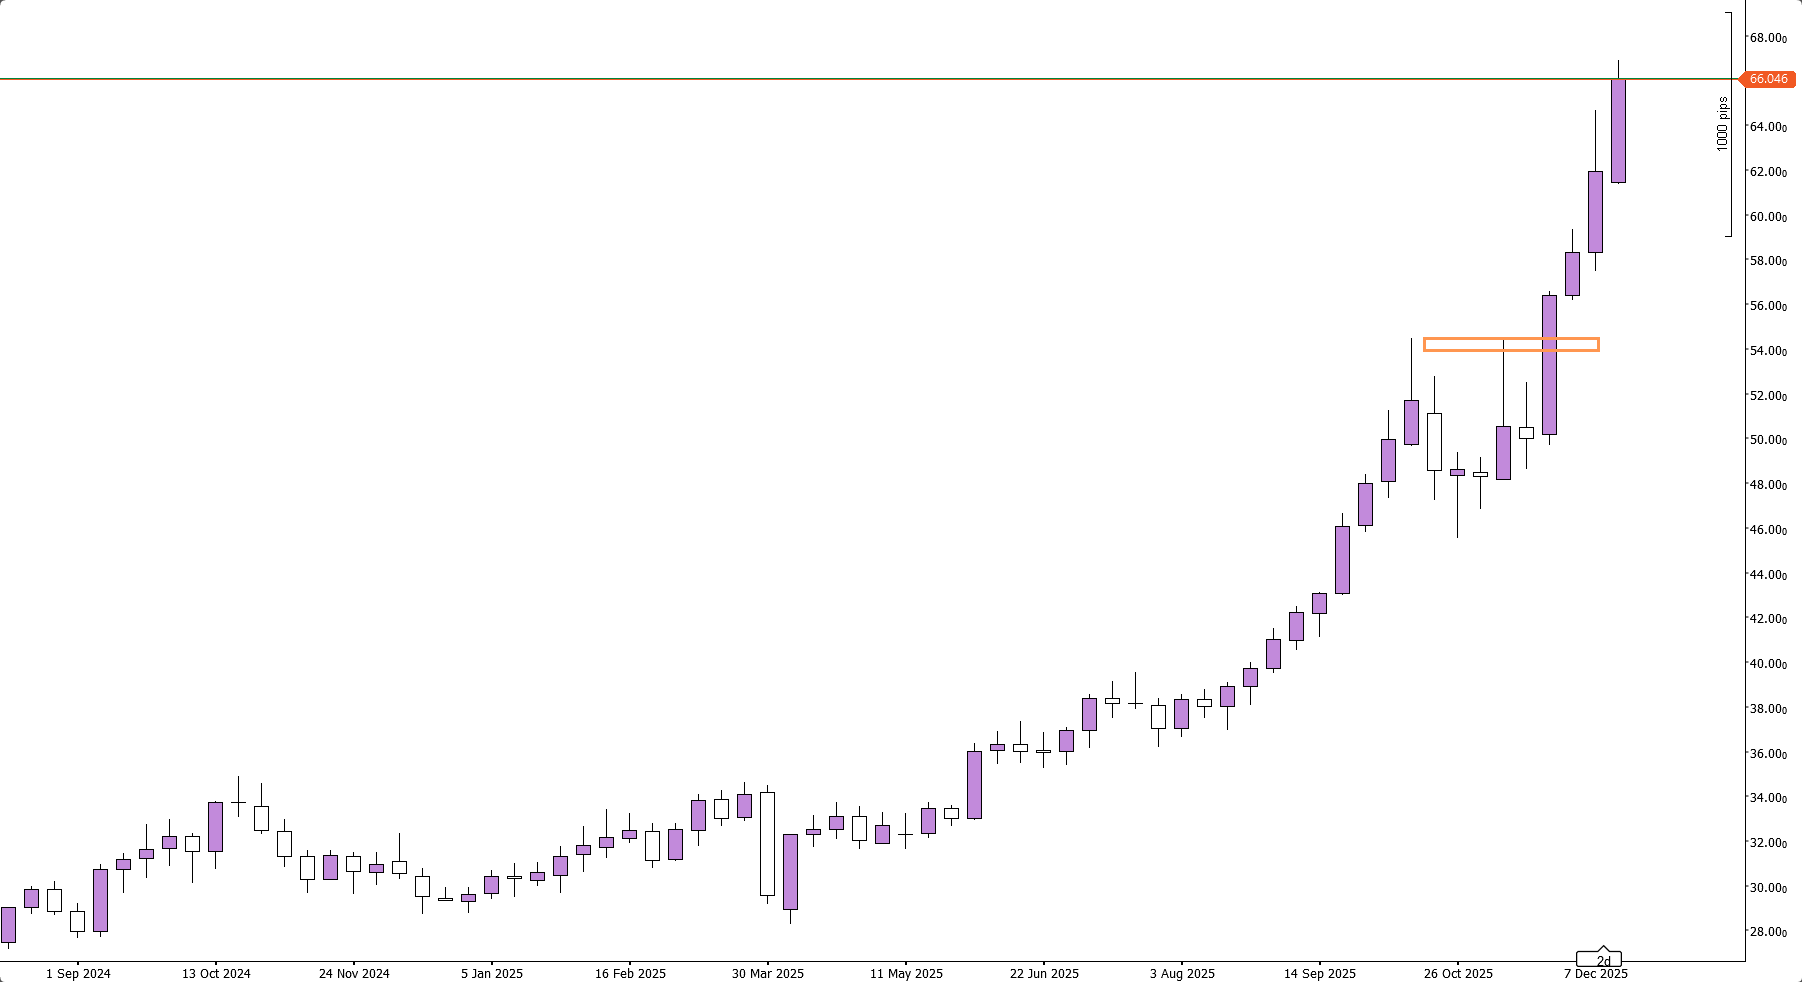
Silver on the Weekly Timeframe
This week has truly been no different. Silver has gained another 9% this week, reaching $66,8 an ounce. This means that one ounce of Silver for the first time in history, costs more than one barrel of oil, as WTI put in a Weekly low at $55
Gold is sitting just below it’s ATHs, needing just a couple of dollar’s to follow Silver and create new highs.
Conclusion
One-sentence summary of the week:
BoJ Rates at 30-year high and An Ounce of Silver is Now Worth more than one Barrel of Oil